


Gold Technical Analysis
Gold continues to demonstrate exceptional strength, extending its bullish trend and trading above the psychologically important $5,000 level. The structure remains bullish, with a clear formation of higher highs and higher lows.
Price is trading well above the three moving averages, M(5), MA(10), and MA(30), which are aligned and sloping upward. The moving averages are acting as dynamic support.
MACD is well above the zero line, and it is signaling accelerating bullish momentum. As long as gold holds above the $4,950–$4,900 region, the overall trend remains bullish.
Gold 4H Chart
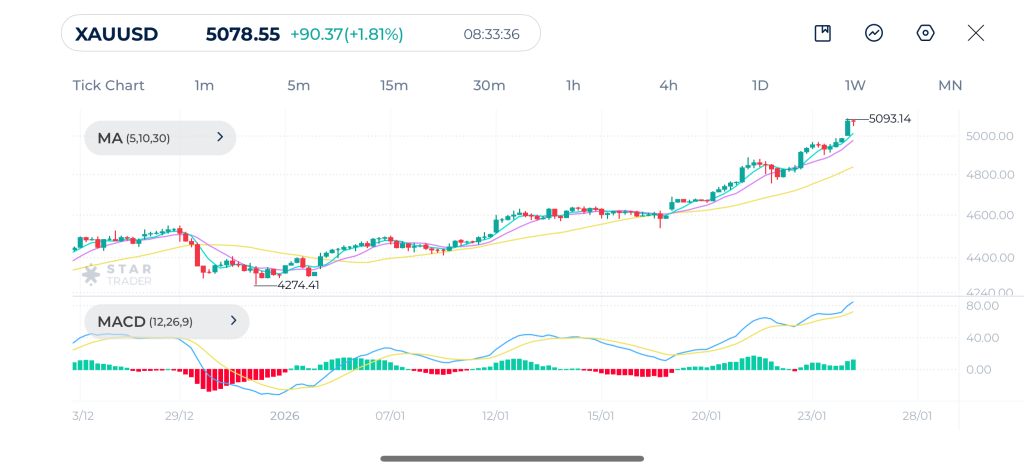
| Resistance | $5,100 | $5,120 | $5,155 |
| Support | $4,985 | $4,957 | $4,913 |
Nasdaq Technical Analysis
On the 4-hour timeframe, Nasdaq-100 is attempting to stabilize after a corrective decline from the 25,900 area. The index previously failed to sustain momentum near that high, leading to a sharp pullback that found support around 24,900. This level acted as a strong demand zone, from which price rebounded aggressively.
Recently, the index has reclaimed the short moving averages, while the 30-period moving average is still slightly above price and flattening. Maintaining that level would strengthen the case for a continuation toward the 25,900 highs, while rejection would signal that the current move is merely a corrective bounce.
MACD has crossed above the signal line, indicating that bearish momentum has faded and bullish momentum is gradually building. However, the MACD remains close to the zero line, highlighting that momentum is still developing.
Nasdaq 4H Chart
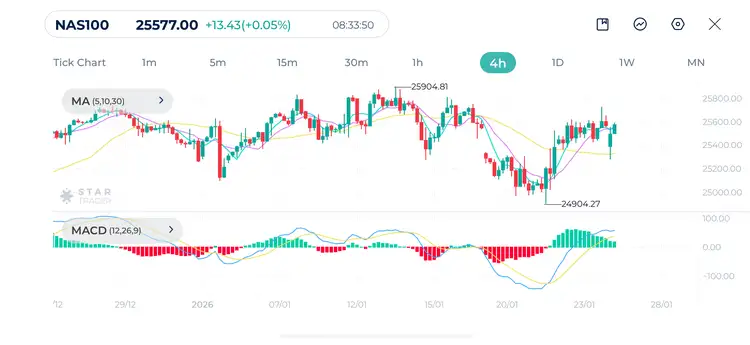
| Resistance | 25,638 | 25,712 | 25,790 |
| Support | 25,342 | 25,255 | 25,103 |
Bitcoin Technical Analysis
Bitcoin remains weak in the short term as seen on the 4-hour timeframe despite the recent rebound from the $86,000–$87,000 area.
Price is still trading below the 30-period moving average, which continues to slope downward and act as dynamic resistance. Although the short term moving averages MA(5) and MA(10) have turned slightly higher, they remain below the 30-period average. For a meaningful structural change, Bitcoin would need to reclaim and hold above the $90,500–$92,000 zone.
MACD behavior supports this cautious view. While the indicator has started to rise from deeply negative levels and the histogram has contracted, it remains below the zero line. This suggests that downside momentum is weakening but not yet replaced by sustained bullish momentum.
Bitcoin 4H Chart
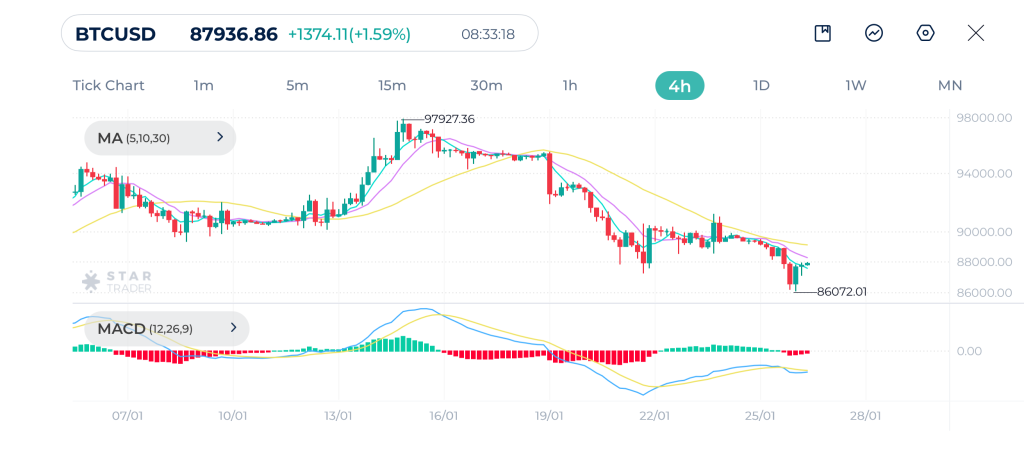
| Resistance | $88,469 | $89,175 | $91,122 |
| Support | $87,176 | $85,987 | $83,120 |
Tags
Open Live Account
Please enter a valid country
No results found
No results found
Please enter a valid email
Please enter a valid verification code
1. 8-16 characters + numbers (0-9) 2. blend of letters (A-Z, a-z) 3. special characters (e.g, !a#S%^&)
Please enter the correct format
Please tick the checkbox to proceed
Please tick the checkbox to proceed
Important Notice
STARTRADER does not accept any applications from Australian residents.
To comply with regulatory requirements, clicking the button will redirect you to the STARTRADER website operated by STARTRADER PRIME GLOBAL PTY LTD (ABN 65 156 005 668), an authorized Australian Financial Services Licence holder (AFSL no. 421210) regulated by the Australian Securities and Investments Commission.
CONTINUEImportant Notice for Residents of the United Arab Emirates
In alignment with local regulatory requirements, individuals residing in the United Arab Emirates are requested to proceed via our dedicated regional platform at startrader.ae, which is operated by STARTRADER Global Financial Consultation & Financial Analysis L.L.C.. This entity is licensed by the UAE Capital Market Authority (CMA) under License No. 20200000241, and is authorised to introduce financial services and promote financial products in the UAE.
Please click the "Continue" button below to be redirected.
CONTINUEError! Please try again.

