








 Web Trader MT5











Brent Technical Analysis
Crude brent has recently experienced strong selling from its peak near $110.33. Currently, price is staging a minor technical rebound, trading around $99.20.
Oil is expected to remain under structural pressure unless a definitive breakout occurs. If the current bounce fails to cross and sustain above the psychological $100.00 barrier and the MA20 moving average, sellers will likely re-enter, dragging the price back down to retest the $96.14 support level.
A break below that level would open the door for a continuation toward the $94.84 support zone. Buyers will need a high-volume close above $103.23 to signal a trend reversal.
Brent 1H Chart
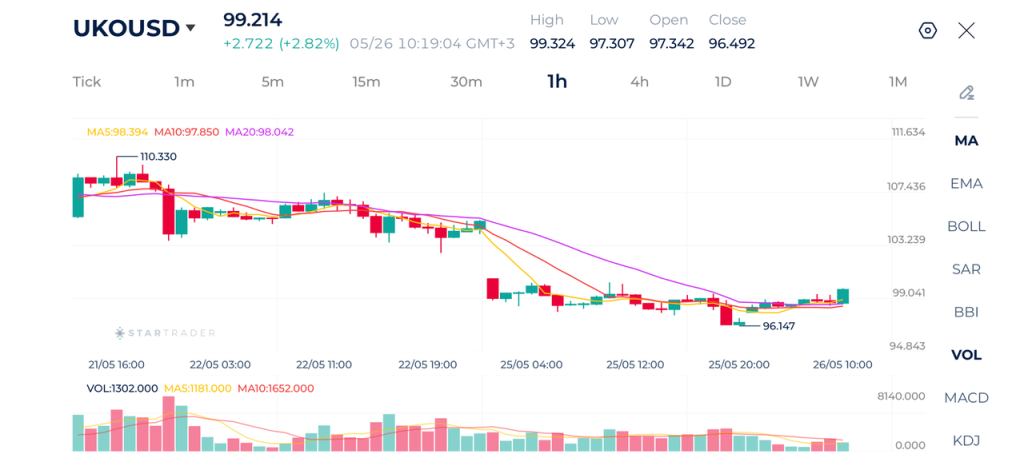
| Resistance | $100.00 | $102.10 | $103.23 |
| Support | $96.14 | $94.84 | $93.00 |
Gold Technical Analysis
After bouncing off a previous low of $4,491, gold prices experienced a strong surge to $4,580.
The current price action shows gold struggling at $4,524. While the price is attempting to find temporary footing near the $4,524 horizontal structural level.
In the near term, the expectation is for continued weakness. Because the breakdown happened on strong momentum, any minor intraday rallies toward the $4,535–$4,540 zone are likely to face heavy selling pressure as traders look to sell the ribbon.
If the current structural support at $4,524 fails to hold, the next logical magnet for sellers is a complete retest of the major multi-day support level at $4,491. Only a clean reclamation of $4,562 would shift the bias back to neutral.
Gold 1H Chart
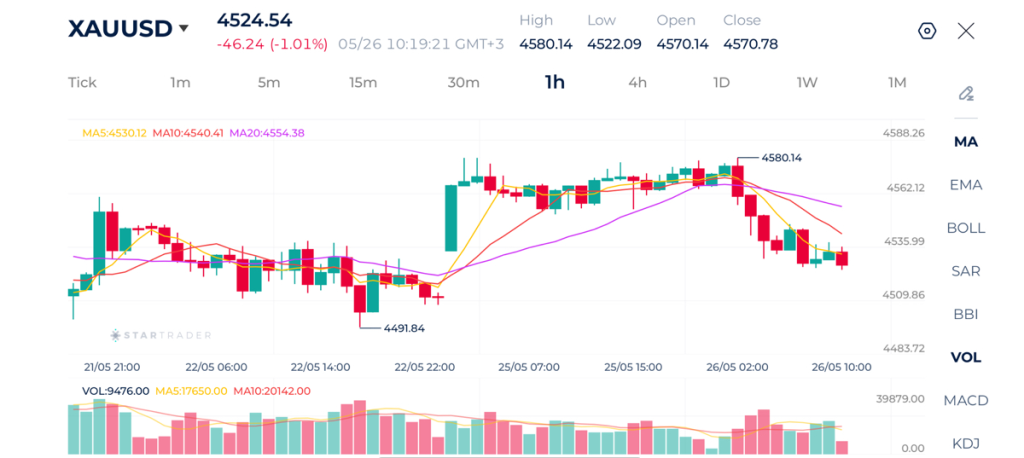
| Resistance | $4,562 | $4,580 | $4,600 |
| Support | $4,510 | $4,491 | $4,465 |
S&P 500 Technical Analysis
The S&P 500 established a steady upward trajectory over the past few days. However, upon reaching a new high, buying pressure exhausted, and the index began moving sideways before breaking below its short-term moving averages.
Currently, the price action is reflecting a minor bearish correction, trading around 7,522. The price has slipped beneath the moving averages MA5 and MA10, which are now beginning to curl downward.
Looking ahead, expectations lean toward a deeper test of support before any potential bullish continuation. The immediate downside target rests near the 7,480 area, where the previous structure provided a stepping stone during the upward rally. If buyers fail to defend this zone, a retracement down toward the major support level near 7,431 could be triggered.
S&P 500 1H Chart
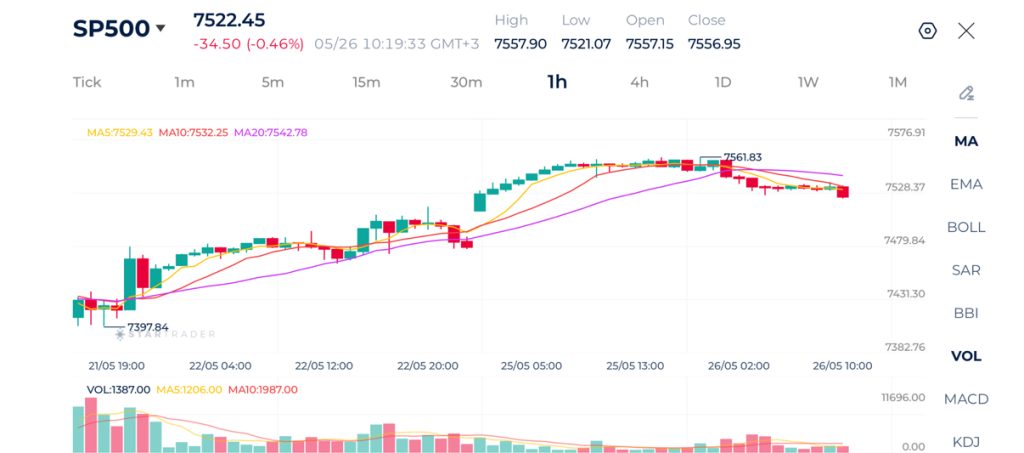
| Resistance | 7,540 | 7,561 | 7,585 |
| Support | 7,500 | 7,480 | 7,431 |
Risk Disclaimer: This material is provided for informational purposes only and does not constitute a recommendation or investment advice. Trading financial instruments on margin involves substantial risk and may not be appropriate for all investors.
Tags


Open Live Account
 Email Address
 Phone Number
Important Notice
STARTRADER does not accept any applications from Australian residents.
To comply with regulatory requirements, clicking the button will redirect you to the STARTRADER website operated by STARTRADER PRIME GLOBAL PTY LTD (ABN 65 156 005 668), an authorized Australian Financial Services Licence holder (AFSL no. 421210) regulated by the Australian Securities and Investments Commission.
Important Notice for Residents of the United Arab Emirates
In alignment with local regulatory requirements, individuals residing in the United Arab Emirates are requested to proceed via our dedicated regional platform at startrader.ae, which is operated by STARTRADER Global Financial Consultation & Financial Analysis L.L.C.. This entity is licensed by the UAE Capital Market Authority (CMA) under License No. 20200000241, and is authorised to introduce financial services and promote financial products in the UAE.
Please click the "Continue" button below to be redirected.


