








 Web Trader MT5











Dow Jones Technical Analysis
Dow Jones has recently peaked at around 48,098 and is now showing signs of a short-term reversal or pullback. The last few candles indicate selling pressure.
During the strong uptrend, the shorter-term moving averages MA(5 and 10) were consistently above the longer-term MA (30), confirming the bullish momentum. However, the recent price drop has caused the price to fall below the shorter-term moving averages.
MACD line is currently below the signal line, and both are trending down, indicating decreasing bullish momentum and increasing selling pressure. The next major support level to watch out for is 46,200
Dow Jones 4H Chart
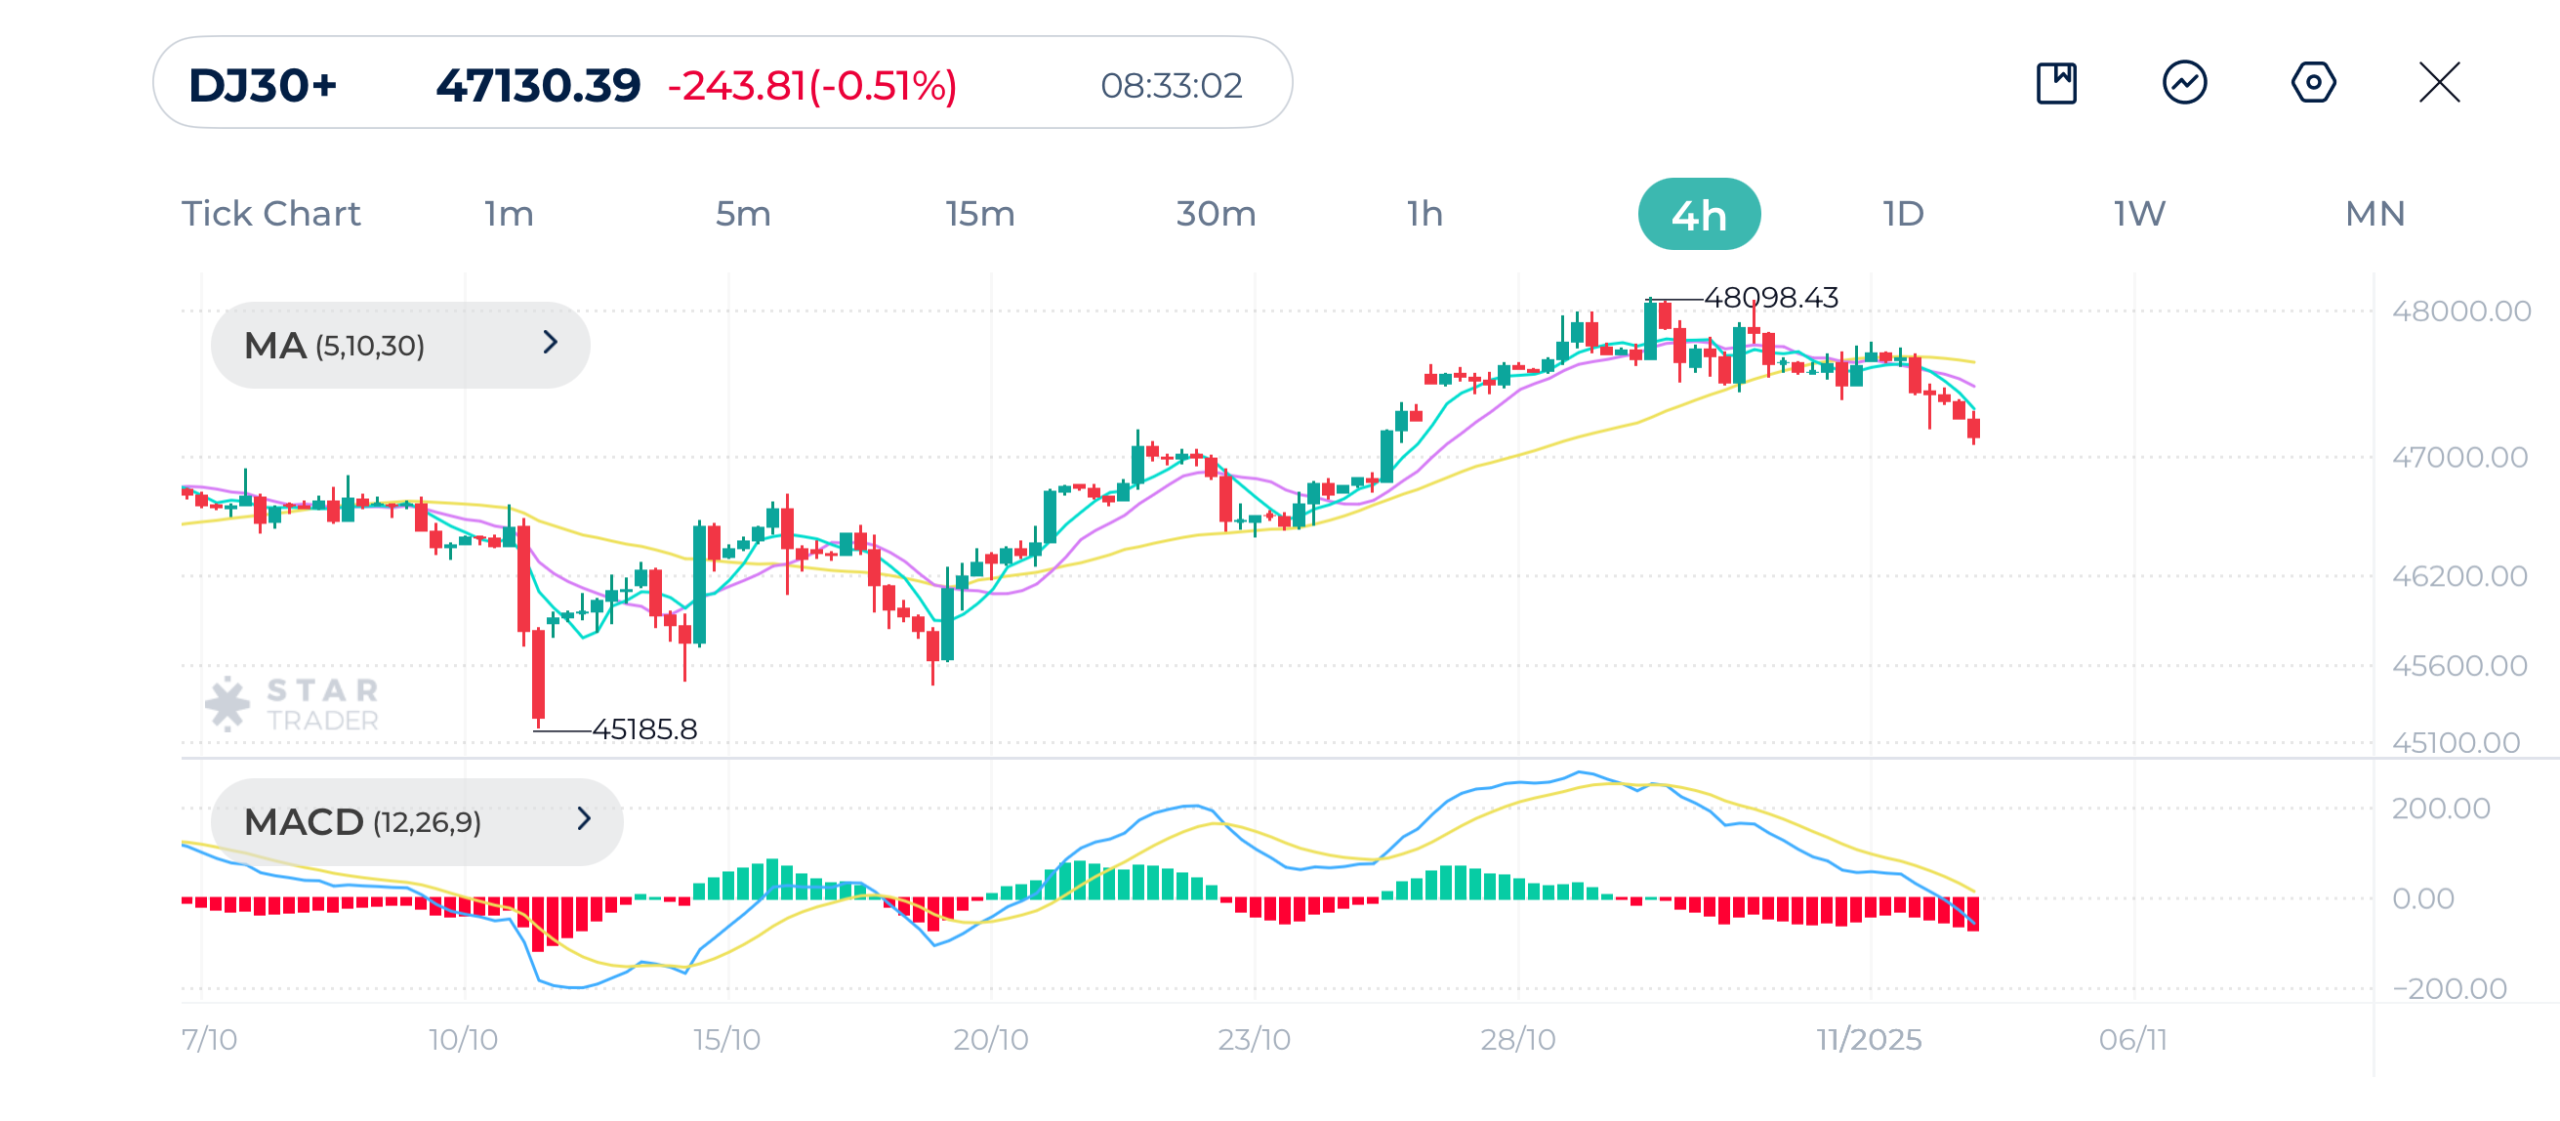
| Resistance | 47,340 | 47,683 | 47,730 |
| Support | 46,855 | 46,710 | 46,412 |
Bitcoin Technical Analysis
Since the mid-October high, Bitcoin has resumed a downward trajectory and is now approaching the prior low support zone. This indicates a potential return to the bearish trend.
Bearish Setup: The price is trading below all three moving averages, with signals a strong downtrend.
The 5-period moving average and 10-period moving average have recently crossed below the 30-period MA, which is a significant bearish signal indicating the downtrend is re-establishing.
MACD line is currently below the yellow signal line and both are accelerating downwards, signaling increasing negative momentum and selling pressure.
Price action strongly supports a continuation of the downtrend. The primary focus for traders would be the potential test and break of the critical support at $103,500.
Bitcoin 4H Chart
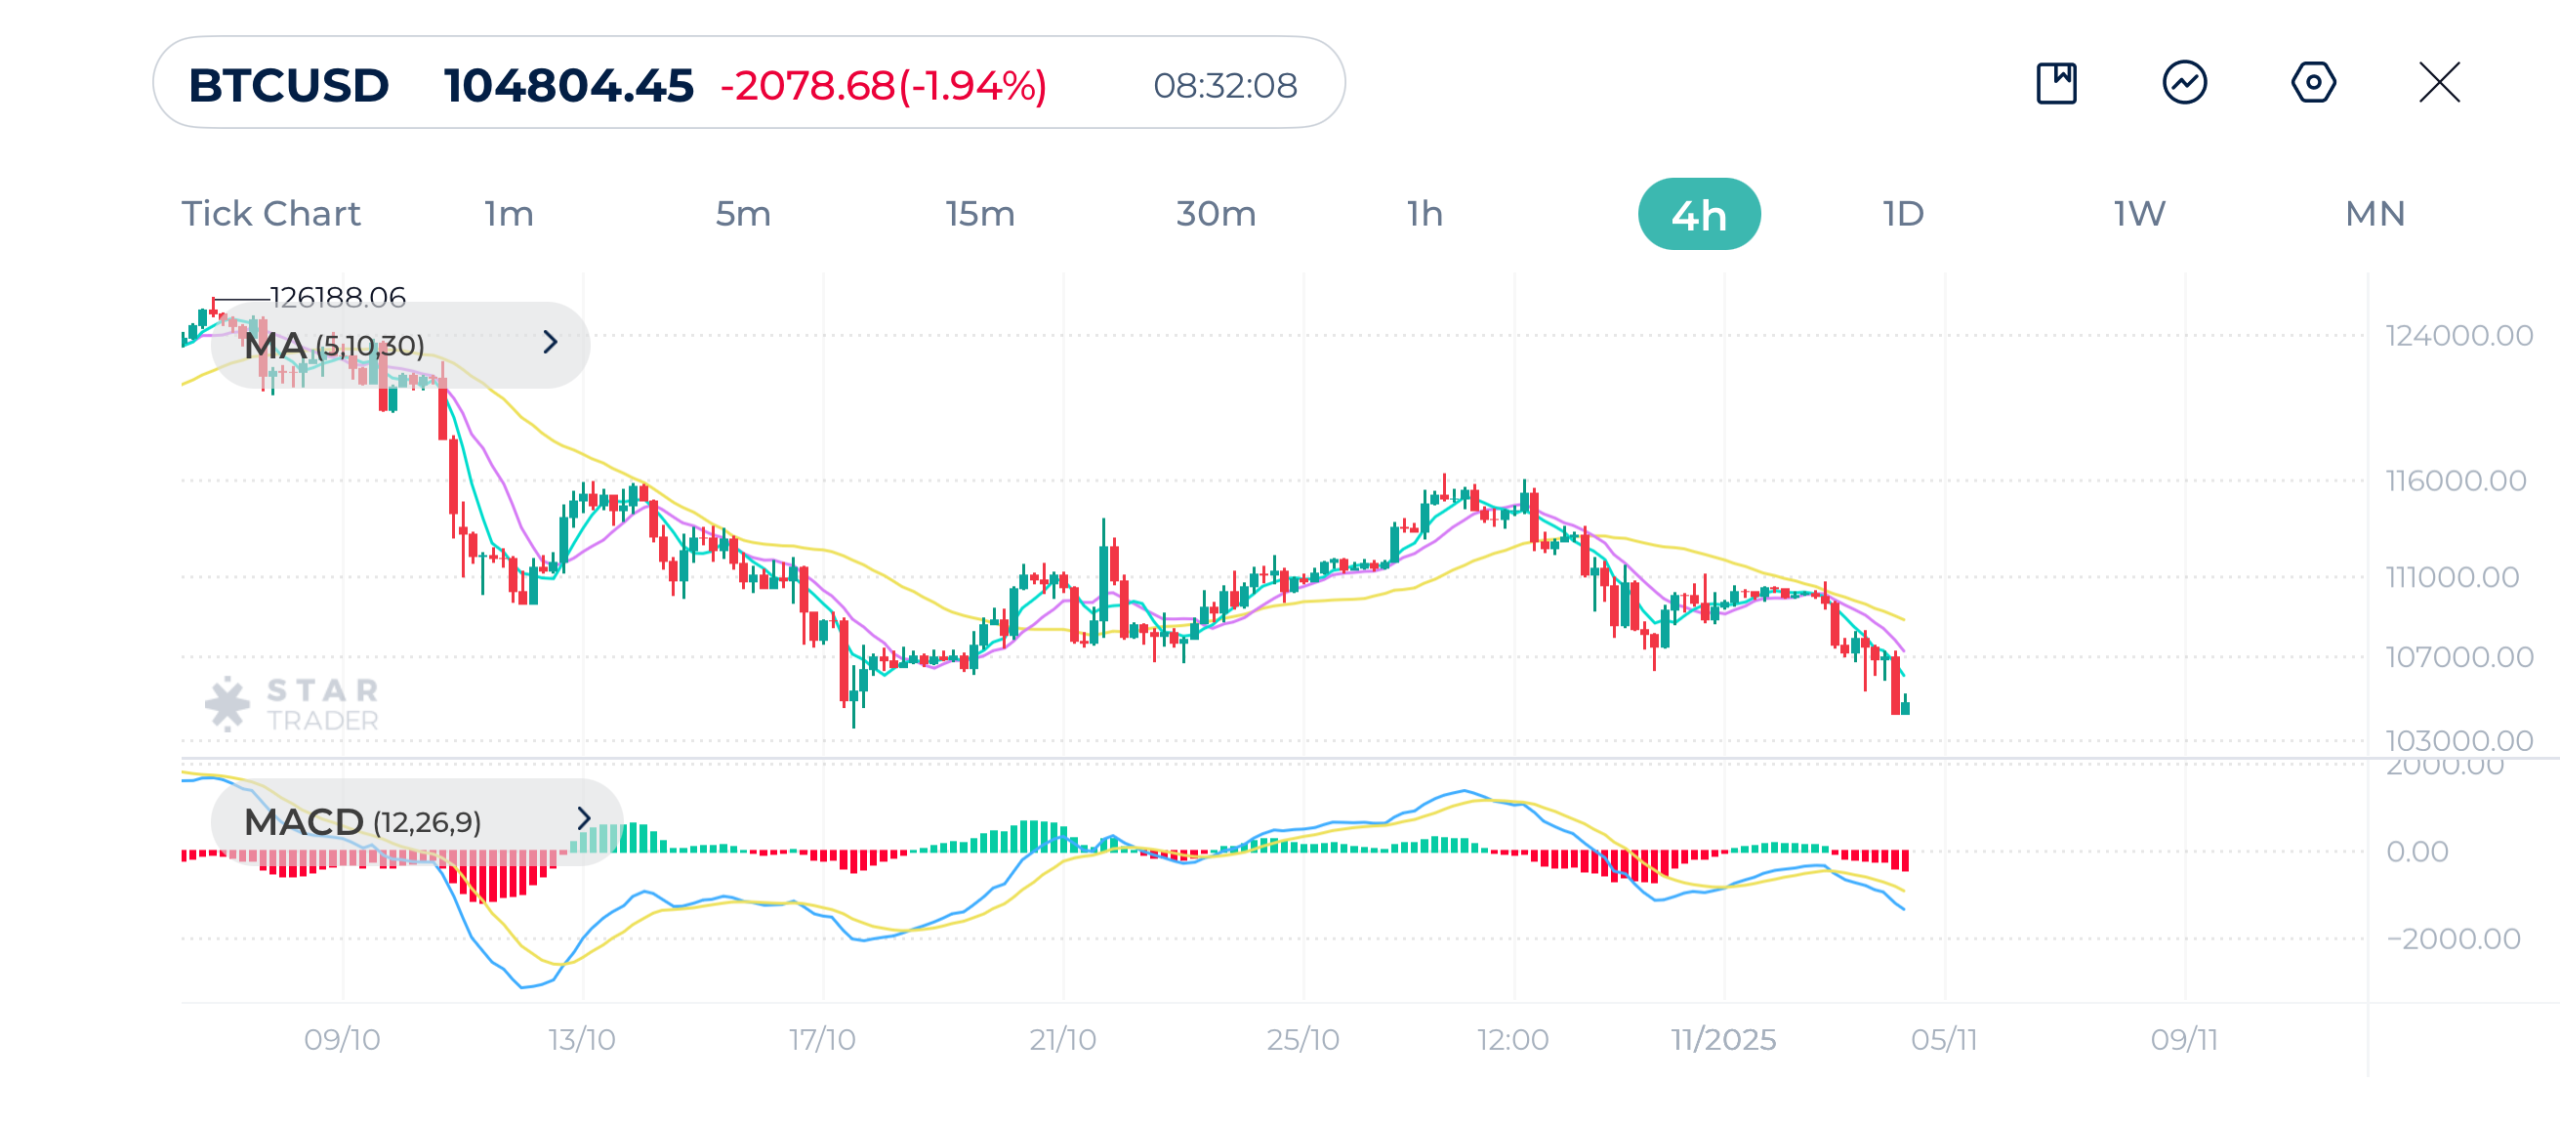
| Resistance | $107,368 | $108,268 | $109,397 |
| Support | $103,578 | $103,133 | $102,127 |
EURUSD Technical Analysis
EUR/USD continues to trade within a defined bearish structure on the hourly chart, with price currently consolidating below a descending trendline that has been acting as dynamic resistance. Moving averages MA(5), MA(10), and MA(30) are aligned in a bearish trend with the long term 30-period moving average likely to act as a resistance.
This price action confirms sellers’ control and signals potential continuation to the downside. However, If buyers manage to push above 1.1560, a further recovery toward 1.17000 could unfold, but as long as the pair remains below 1.15, the medium-term bias stays bearish.
EURUSD 1H Chart
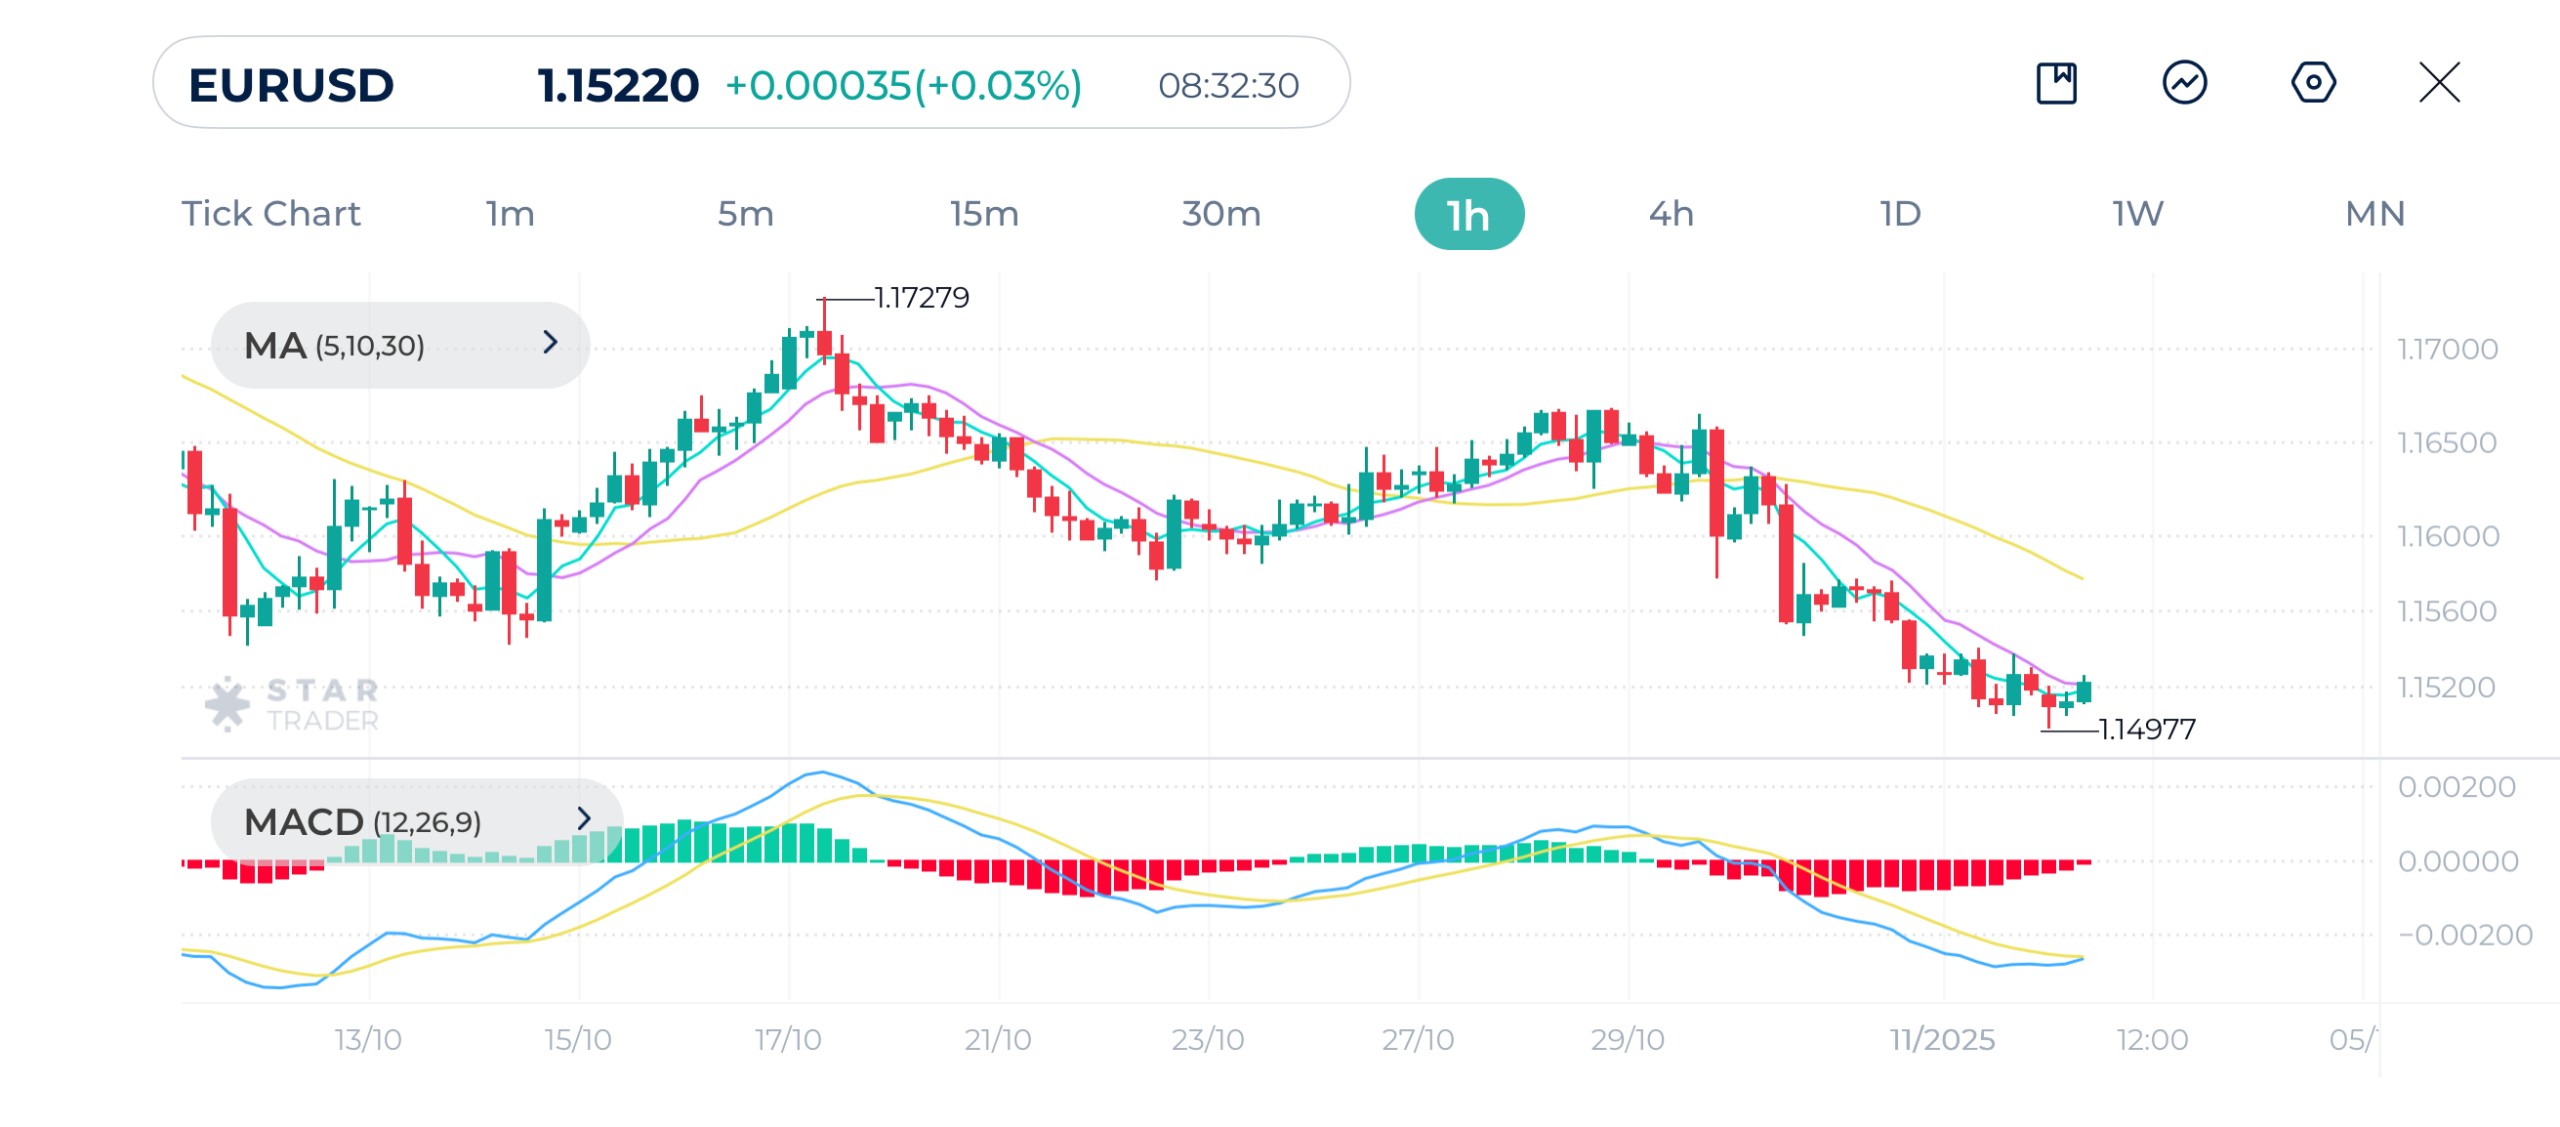
| Resistance | 1.1542 | 1.1578 | 1.1597 |
| Support | 1.1500 | 1.1462 | 1.1394 |
Tags


Open Live Account
 Email Address
 Phone Number
Important Notice
STARTRADER does not accept any applications from Australian residents.
To comply with regulatory requirements, clicking the button will redirect you to the STARTRADER website operated by STARTRADER PRIME GLOBAL PTY LTD (ABN 65 156 005 668), an authorized Australian Financial Services Licence holder (AFSL no. 421210) regulated by the Australian Securities and Investments Commission.
Important Notice for Residents of the United Arab Emirates
In alignment with local regulatory requirements, individuals residing in the United Arab Emirates are requested to proceed via our dedicated regional platform at startrader.ae, which is operated by STARTRADER Global Financial Consultation & Financial Analysis L.L.C.. This entity is licensed by the UAE Capital Market Authority (CMA) under License No. 20200000241, and is authorised to introduce financial services and promote financial products in the UAE.
Please click the "Continue" button below to be redirected.


