


MARKET NEWS SUMMARY
Sterling Pound (GBPUSD)

From the daily time frame, the overall trend for the Cable is bearish. However, from the hourly time frame, GBPUSD seems to be moving horizontally after an initial break to the downside. The RSI and MACD are within the centre-line which shows that price is likely to keep moving horizontally.
PIVOT POINT: 1.3080
| S1 | S2 | S3 | |
| SUPPORT | 1.3100 | 1.3120 | 1.3160 |
| R1 | R2 | R3 | |
| RESISTANCE | 1.3050 | 1.3030 | 1.3010 |
Spot Gold (XAUUSD)

From the overview of price in the daily time frame, GOLD SPOT price has been moving horizontally after an initial drop from the upside. Likewise, from the hourly time frame, the price is also moving in a horizontal direction as the 20 periods MA is moving alongside the current price levels. The RSI and MACD both signal an indecisive movement of price.
PIVOT POINT: 1,930
| S1 | S2 | S3 | |
| SUPPORT | 1,935 | 1,950 | 1,960 |
| R1 | R2 | R3 | |
| RESISTANCE | 1,920 | 1,915 | 1,910 |
S&P 500 (SPX500)

The general trend of SPX500 from the daily time frame is bullish. From the hourly time frame, the price seems to have broken the previous structure to the upside and is likely to retest around the level of 4,500 and a possible retest of the 20 periods moving average before continuing to the upside. The RSI and MACD both signal price continuation to the upside.
PIVOT POINT: 4,500
| S1 | S2 | S3 | |
| SUPPORT | 4,520 | 4,540 | 4,560 |
| R1 | R2 | R3 | |
| RESISTANCE | 4,460 | 4,440 | 4,420 |
Canadian Dollar (USDCAD)

The daily movement of the price of USDCAD is moving in a horizontal direction. However, from the hourly time frame price seems to be bullish and retesting the level of 1.2575 which has a possible intersection with the 2periodsod MA. The MACD and RSI are above the centre-line which signals a continuation of price to the upside.
PIVOT POINT: 1.2575
| S1 | S2 | S3 | |
| SUPPORT | 1.2620 | 1.2650 | 1.2690 |
| R1 | R2 | R3 | |
| RESISTANCE | 1.2550 | 1.2530 | 1.2504 |
Ethereum (ETHUSD)
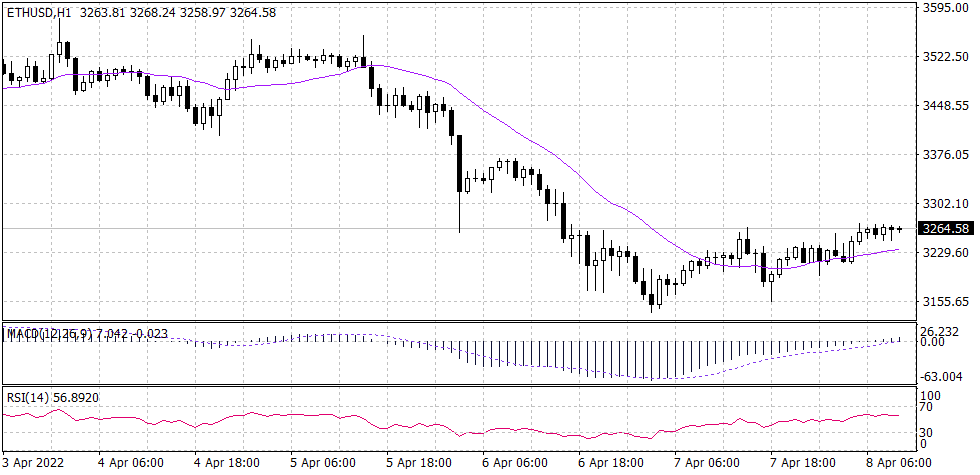
From the overview of the price in ETHUSD, the overall trend from the daily time frame looks bullish. Similarly, from the hourly time frame price has formed an ascending triangle which signals a bullish momentum of price to the upside. The RSI indicates a possible movement of price to the upside.
PIVOT POINT: 3,263.0
| S1 | S2 | S3 | |
| SUPPORT | 3,360 | 3,424 | 3,470 |
| R1 | R2 | R3 | |
| RESISTANCE | 3,210 | 3,160 | 3,115 |
Tags
Open Live Account
Please enter a valid country
No results found
No results found
Please enter a valid email
Please enter a valid verification code
1. 8-16 characters + numbers (0-9) 2. blend of letters (A-Z, a-z) 3. special characters (e.g, !a#S%^&)
Please enter the correct format
Please tick the checkbox to proceed
Please tick the checkbox to proceed
Important Notice
STARTRADER does not accept any applications from Australian residents.
To comply with regulatory requirements, clicking the button will redirect you to the STARTRADER website operated by STARTRADER PRIME GLOBAL PTY LTD (ABN 65 156 005 668), an authorized Australian Financial Services Licence holder (AFSL no. 421210) regulated by the Australian Securities and Investments Commission.
CONTINUEImportant Notice for Residents of the United Arab Emirates
In alignment with local regulatory requirements, individuals residing in the United Arab Emirates are requested to proceed via our dedicated regional platform at startrader.ae, which is operated by STARTRADER Global Financial Consultation & Financial Analysis L.L.C.. This entity is licensed by the UAE Capital Market Authority (CMA) under License No. 20200000241, and is authorised to introduce financial services and promote financial products in the UAE.
Please click the "Continue" button below to be redirected.
CONTINUEError! Please try again.

