


market news summary
Market participants prefer cash and yields over bullions, U.S. Dollar continues its losses, and the dollar index hits the lowest in over a month. Crude oil in over two months’ highs before the European sanctions meeting.
U.S. Dollar Index (USDX)
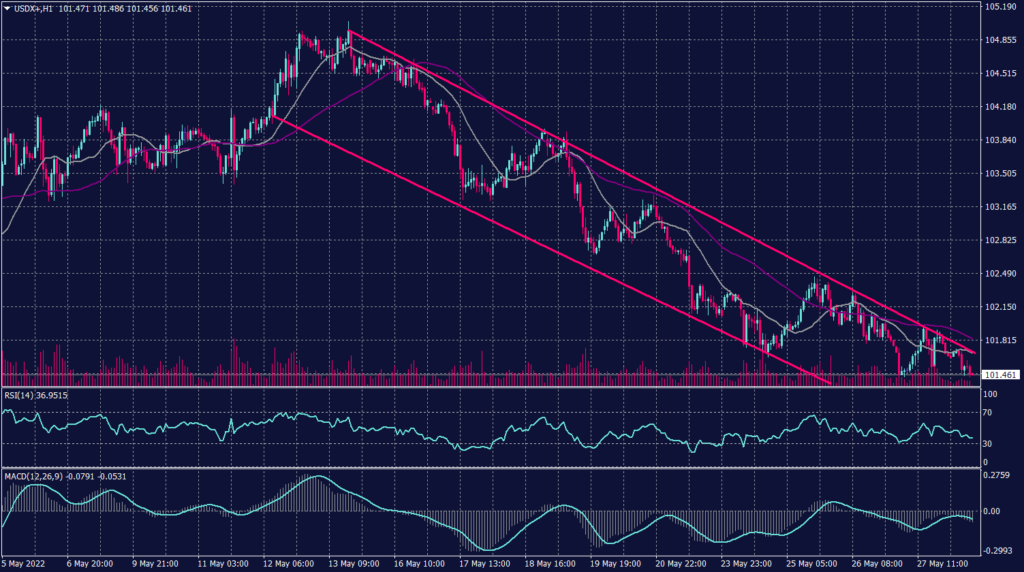
The dollar remains trading within its downward channel, as traders lowered Fed hike expectations amid signs the Fed might slow or pause its tightening cycle in the second half of the year.
Technically:
The U.S. dollar index is testing 101.43 for the second trading day flirting with its lowest rate in over a month. Additionally, the index still trading below the 20-day and 55-day moving average on the daily chart and hourly chart indicating a possibility for a further decline.
Likewise, the index is cementing its declining pattern on the hourly chart which targets 101.20 on the hourly chart. Technical indicators show a likelihood of further decline.
PIVOT POINT: 101.40
| SUPPORT | RESISTANCE |
| 101.20 | 101.60 |
| 101.00 | 102.60 |
| 100.70 | 103.10 |
Sterling Pounds (GBPUSD)
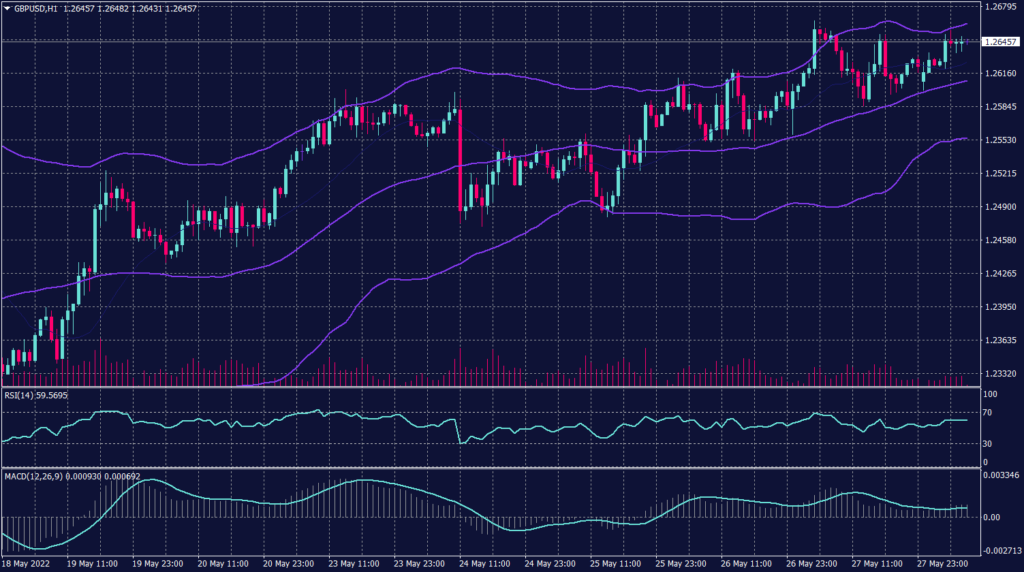
The Cable breaks the pressure and tests its resistance at 1.2250 for the third time on the hourly chart and the second time on the daily chart. Additionally, the sterling officially penetrated the downward channel after bouncing from 1.2155 on the daily chart and closing twelve up days.
The price chart is touching the upper band of Bollinger Bands indicators, which signals a higher possibility to retreat towards 1.2560 on the hourly chart and 1.2460 on the daily chart.
Meanwhile, the pair shows a possibility to move on the hourly time frame between 1.2440 and 1.2500. The RSI and MACD show signals for a further decline, while price action retains the reading of 1.2100 daily.
PIVOT POINT: 1.2620
| SUPPORT | RESISTANCE |
| 1.2500 | 1.2695 |
| 1.2440 | 1.2750 |
| 1.2350 | 1.2790 |
Japanese Yen (USDJPY)
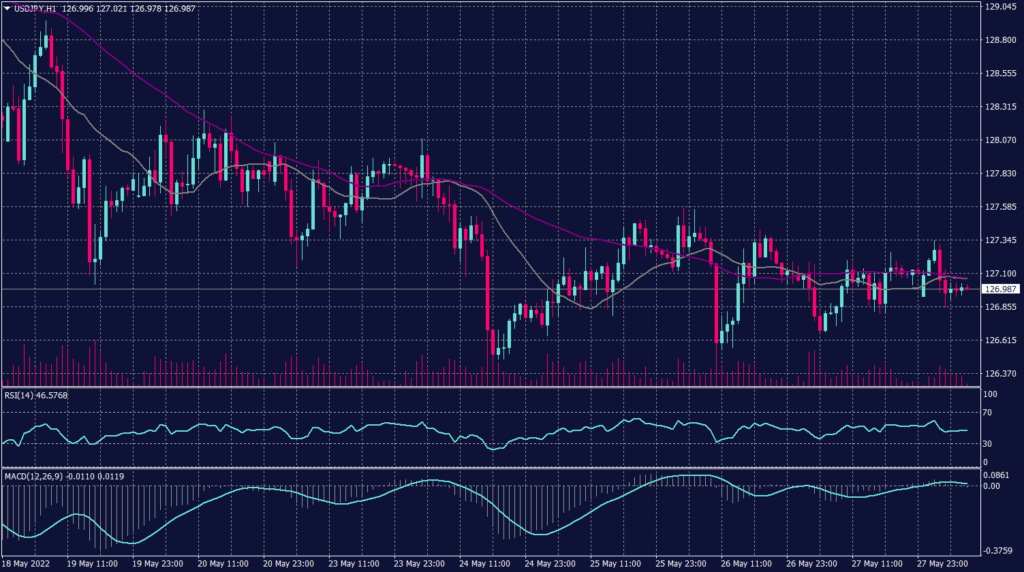
The Japanese Yen holds ground around 127.00 for the fifth day in a row and flattens its technical reading into neutral levels.
Meanwhile, the pair is setting its price action readings to further decline, but technical indicators are showing neutral readings.
PIVOT POINT: 127.00
| SUPPORT | RESISTANCE |
| 126.30 | 127.40 |
| 125.90 | 128.00 |
| 125.60 | 128.40 |
Spot Gold (XAUUSD)
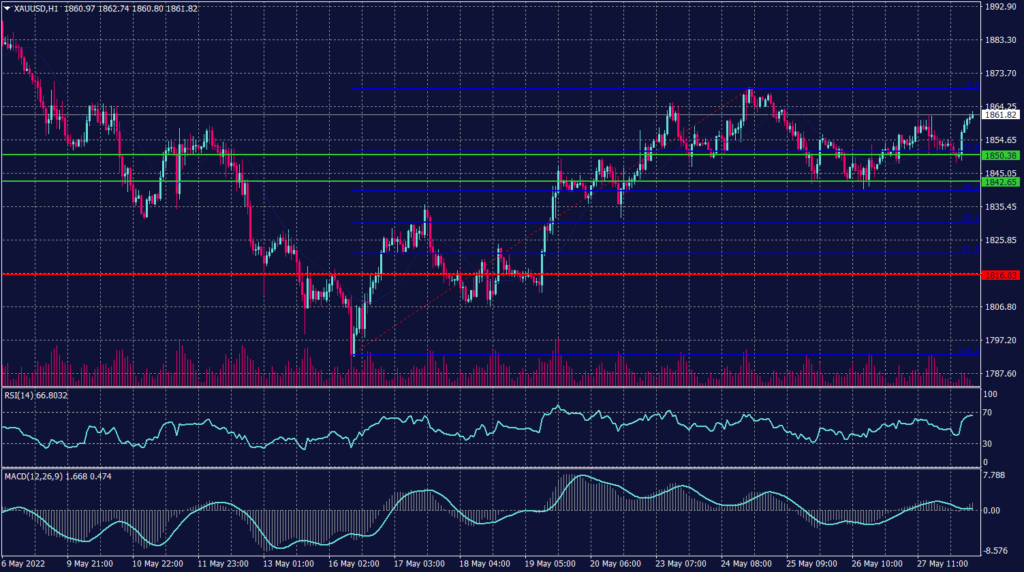
Gold traded up during the Asian session, firming in volatile trading. The weaker dollar pushed the precious metal, but the gold appeared unstable. Additionally, other precious metals are also trading upward indicating a safer trading pattern in the market.
Technically:
Gold prices moved up during the early sessions after dipping yesterday. However, spot gold is moving upwards from the support at $1,850 per ounce and is expected to remain unless it broke below 1,842. Technical indicators show a possibility of a decline, as RSI is showing the gold is overbought, while MACD is neutral.
PIVOT POINT: 1,860
| SUPPORT | RESISTANCE |
| 1,850 | 1,875 |
| 1,810 | 1,895 |
| 1,800 | 1,905 |
West Texas Crude (USOUSD)
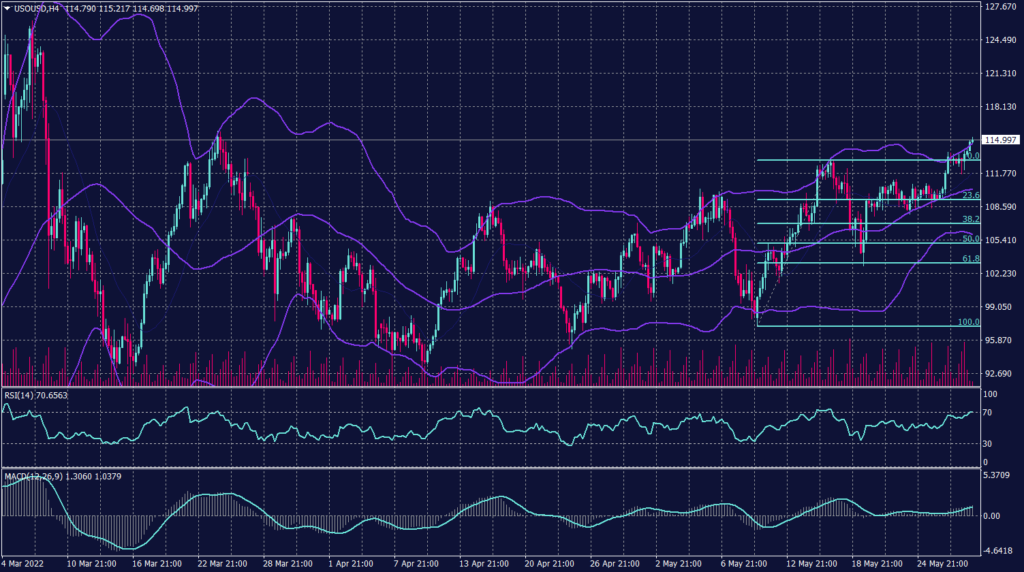
Oil was up this morning, hitting two-month highs as market participants wait to confirm if the European Union (EU) will reach an agreement on the sixth package of sanctions against Russia. Meanwhile, Brent oil futures rose 0.73% to $116.40, and WTI futures rose 0.85% to $116.05, extending the previous week’s gains.
Technically:
WTI penetrated the resistance of 112.75 and moved towards the next resistance of 115.00. However, according to the Bollinger bands, WTI is set to a correction after touching the upper band and it may run back towards the 55 periods moving average.
Fibonacci retracement shows firm support at 112.75 and the 55 period moving average reads a further advancement. RSI is showing WTI is overbought, while MACD shows a continuation.
PIVOT POINT: 114.75
| SUPPORT | RESISTANCE |
| 107.10 | 115.00 |
| 105.75 | 115.60 |
| 104.30 | 117.00 |
Tags
Open Live Account
Please enter a valid country
No results found
No results found
Please enter a valid email
Please enter a valid verification code
1. 8-16 characters + numbers (0-9) 2. blend of letters (A-Z, a-z) 3. special characters (e.g, !a#S%^&)
Please enter the correct format
Please tick the checkbox to proceed
Please tick the checkbox to proceed
Important Notice
STARTRADER does not accept any applications from Australian residents.
To comply with regulatory requirements, clicking the button will redirect you to the STARTRADER website operated by STARTRADER PRIME GLOBAL PTY LTD (ABN 65 156 005 668), an authorized Australian Financial Services Licence holder (AFSL no. 421210) regulated by the Australian Securities and Investments Commission.
CONTINUEImportant Notice for Residents of the United Arab Emirates
In alignment with local regulatory requirements, individuals residing in the United Arab Emirates are requested to proceed via our dedicated regional platform at startrader.ae, which is operated by STARTRADER Global Financial Consultation & Financial Analysis L.L.C.. This entity is licensed by the UAE Capital Market Authority (CMA) under License No. 20200000241, and is authorised to introduce financial services and promote financial products in the UAE.
Please click the "Continue" button below to be redirected.
CONTINUEError! Please try again.

