


U.S. Dollar Index (USDX)
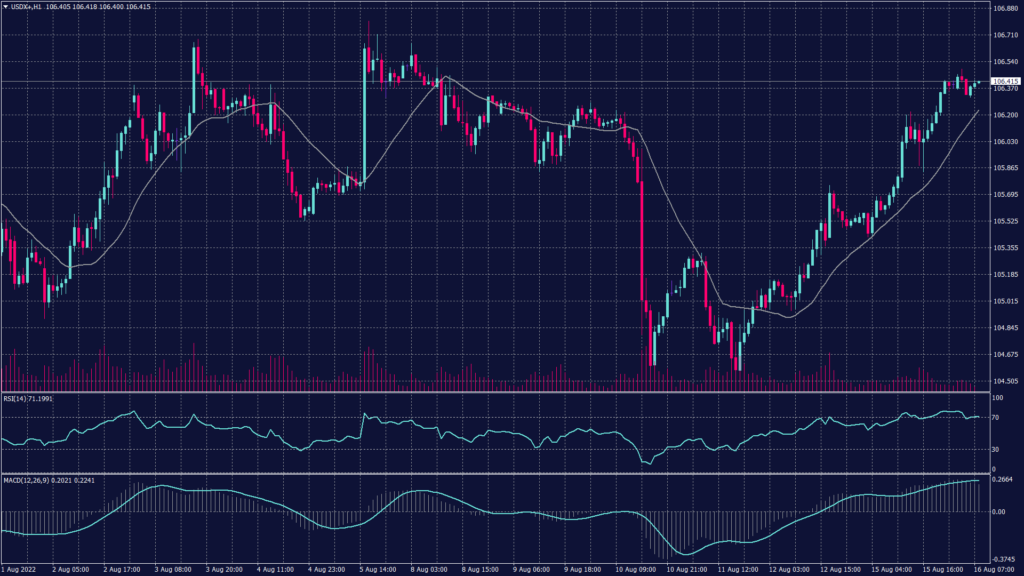
The dollar index, which measures the greenback against six major peers, held steady at 106.51, just below the previous session’s peak of 106.55, the strongest since last week.
The global safety bid was driven by a group of weak world economic indicators. Data showed U.S. single-family homebuilders’ confidence, while New York state factory activity fell in August to its lowest levels since near the start of the COVID-19 pandemic.
Technically:
The dollar index traded the majority of the morning sessions below the resistance at 106.50 and slightly above the hourly chart support at 106.30. However, the hourly chart shows a continuation to the uptrend started on August 11 from the previously analyzed double bottom pattern.
Meanwhile on the daily chart, the index is struggling to penetrate the resistance range of 106.40 and 106.50, which slowed the momentum and flattened the technical indicators readings.
PIVOT POINT: 106.40
| SUPPORT | RESISTANCE |
| 106.20 | 106.50 |
| 106.00 | 106.60 |
| 105.50 | 106.80 |
Chinese Yuan (USDCNH)
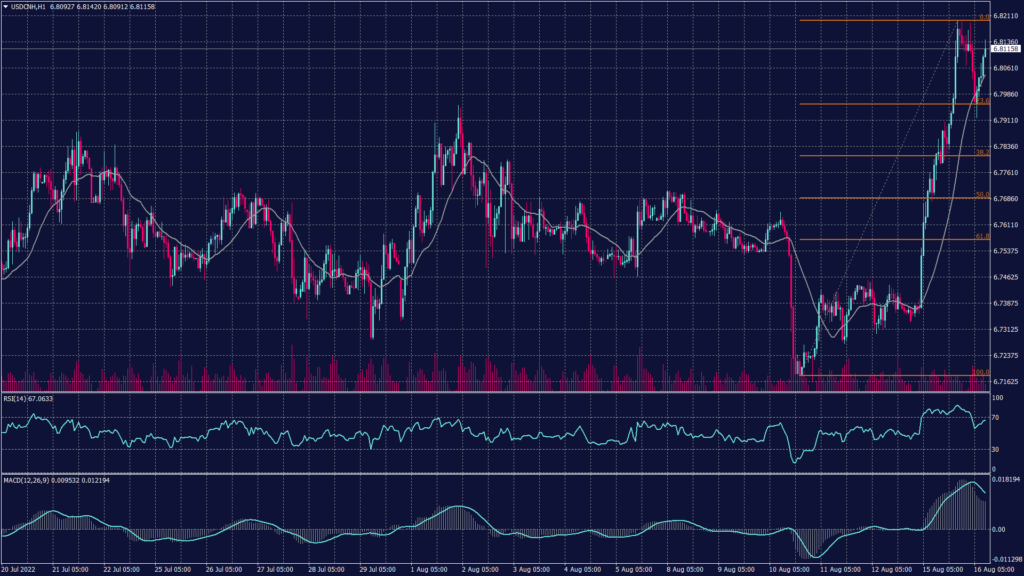
China’s central bank set its rate for the yuan lower on Tuesday, failing to show any overt pushback after the currency slid to a three-month low against the dollar on Monday. The PBoC set the yuan reference at 6.7730 per dollar, 0.5% lower than the previous print, which is the largest daily cut since August 3.
The yuan’s slide on Monday pushed it through the pivotal level at 6.800 level, widening its discount to the onshore rate to the largest since May.
The pair remains positive despite the down swing yesterday after bouncing from 6.7950. Meanwhile, Fibonacci retracement on the hourly chart shows a high possibility of gains towards the resistance range 6.8125 and 6.8190. Meanwhile, the daily chart is still showing a slow uptrend but also shows a strong resistance at 6.8370.
PIVOT POINT: 6.8060
| SUPPORT | RESISTANCE |
| 6.7960 | 6.8130 |
| 6.7915 | 6.8190 |
| 6.7850 | 6.8260 |
Spot Gold (XAUUSD)
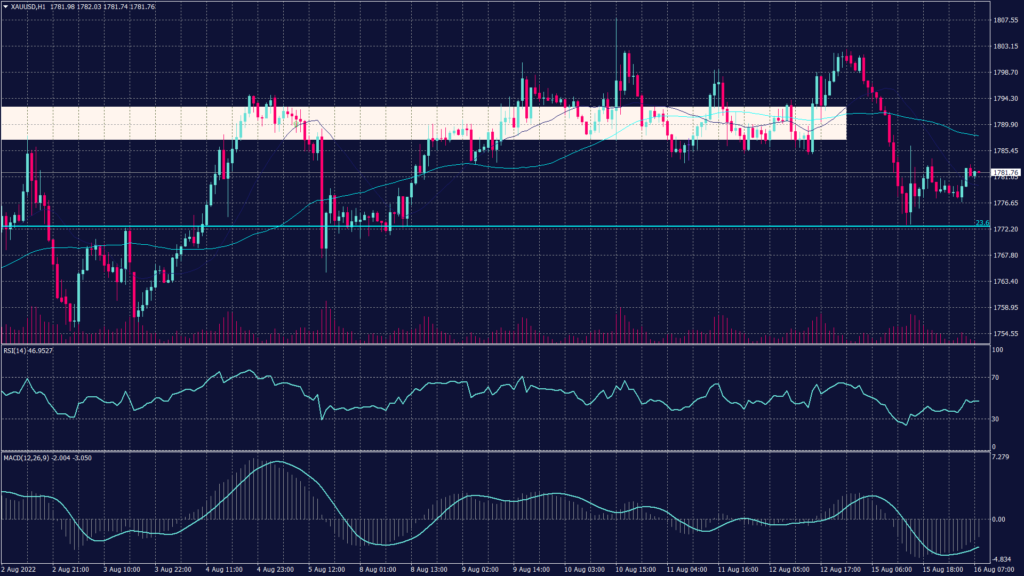
Gold steadied after the biggest drop in a month as investors rushed to the dollar amid growing signs of an economic slowdown. Spot gold was little changed at $1,778.95 per ounce this morning after tumbling 1.3% on Monday.
Bullion has carried a new dip after rising for four weeks as a gauge of the greenback renewed its ascent. The latest U.S. data showed rapidly cooling manufacturing and slumping homebuilder sentiment, which added to concerns over the risks to global growth following weak figures from China.
Spot gold remains committed to the downtrend channel shown on the daily chart as gold prices retreated after reaching the resistance at 1,800. Meanwhile, the hourly chart shows support at 1,770 despite the heavy selloff. Also on the hourly chart, technical indicators show a horizontal signals and indecisiveness.
PIVOT POINT: 1,780
| SUPPORT | RESISTANCE |
| 1,770 | 1,800 |
| 1,767 | 1,810 |
| 1,759 | 1,825 |
West Texas Crude (USOUSD)
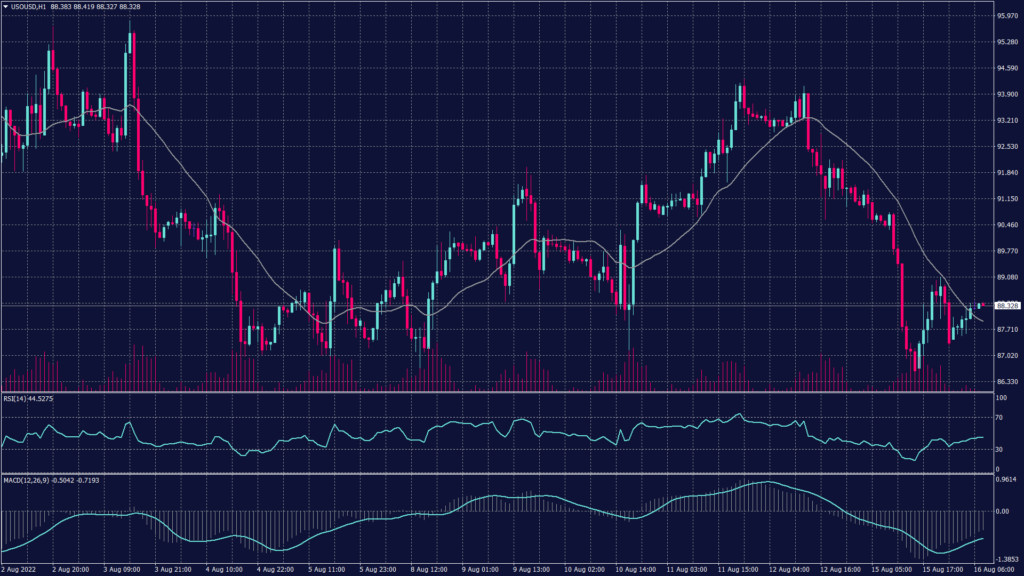
Oil declined for a third day as a deepening global slowdown looked set to coincide with an increase in supply from OPEC producers.
West Texas Intermediate futures slid below $89 a barrel after falling around 5% over the previous two sessions. Mounting signs of an economic downturn swept through markets on Monday as bearish US data including rapidly cooling manufacturing followed weaker-than-expected Chinese numbers. WTI futures 2.9% declined 0.7% to $88.82 a barrel. Meanwhile, Brent crude futures dropped 0.9% to $94.21 a barrel.
WTI found support at $87.40 per barrel on the hourly chart which can be considered speculative area as long as the prices haven’t dropped below $87 per barrel. Meanwhile, the daily chart shows a continuation to the downtrend and high possibility of breaking below $87 per barrel towards $82.90.
PIVOT POINT: 88.30
| SUPPORT | RESISTANCE |
| 88.00 | 88.70 |
| 87.40 | 90.60 |
| 86.50 | 91.70 |
Tags
Open Live Account
Please enter a valid country
No results found
No results found
Please enter a valid email
Please enter a valid verification code
1. 8-16 characters + numbers (0-9) 2. blend of letters (A-Z, a-z) 3. special characters (e.g, !a#S%^&)
Please enter the correct format
Please tick the checkbox to proceed
Please tick the checkbox to proceed
Important Notice
STARTRADER does not accept any applications from Australian residents.
To comply with regulatory requirements, clicking the button will redirect you to the STARTRADER website operated by STARTRADER PRIME GLOBAL PTY LTD (ABN 65 156 005 668), an authorized Australian Financial Services Licence holder (AFSL no. 421210) regulated by the Australian Securities and Investments Commission.
CONTINUEImportant Notice for Residents of the United Arab Emirates
In alignment with local regulatory requirements, individuals residing in the United Arab Emirates are requested to proceed via our dedicated regional platform at startrader.ae, which is operated by STARTRADER Global Financial Consultation & Financial Analysis L.L.C.. This entity is licensed by the UAE Capital Market Authority (CMA) under License No. 20200000241, and is authorised to introduce financial services and promote financial products in the UAE.
Please click the "Continue" button below to be redirected.
CONTINUEError! Please try again.

