


market news summary
U.S. Dollar Index (USDX)
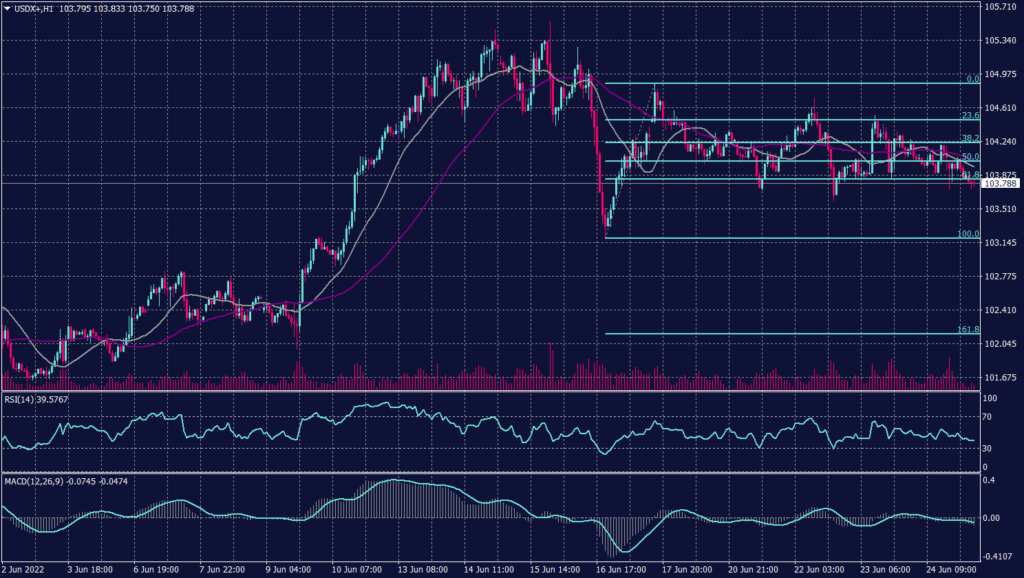
The USDX opened lower today and traded horizontally around 104 as recission fears were intense during the G-7 meeting. But it retains its horizontal movement on the hourly chart between 38.2 and 61.8 on Fibonacci retracement ranging between 103.85 and 104.40.
Meanwhile, the USDX keeps pressuring the critical support at 104 and flagging a higher possibility of falling towards 103.10 if the current level didn’t hold. Additionally, hourly chart price action indicates a further decline while the technical indicators are neutral.
Meanwhile, the daily chart indicates a continuation of the uptrend in the long term under the condition of holding above 104. Technical indicators can’t confirm the continuation while moving averages show horizontal signals.
PIVOT POINT: 104.00
| SUPPORT | RESISTANCE |
| 103.50 | 104.60 |
| 102.60 | 105.10 |
| 102.30 | 105.60 |
Euro (EURUSD)
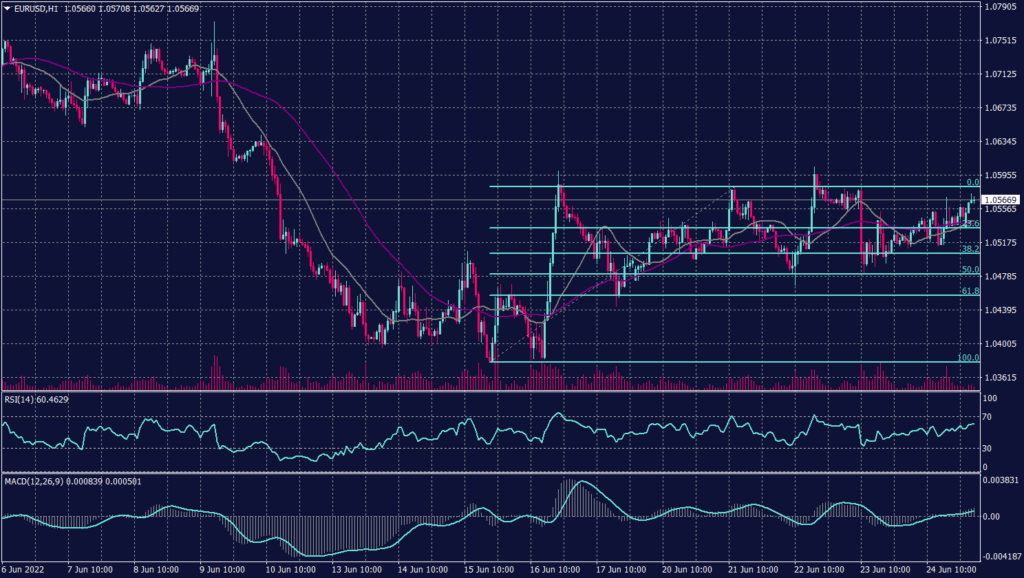
On the hourly chart, the Euro was optimistic this morning and traded in a corrective trend towards 1.0550 and 1.0600. Meanwhile, EURUSD remains in the declining channel towards 1.0400, while technical indicators confirm the decline on the daily chart.
PIVOT POINT:1.0520
| SUPPORT | RESISTANCE |
| 1.0480 | 1.0550 |
| 1.0450 | 1.0600 |
| 1.0400 | 1.0670 |
Sterling Pound (GBPUSD)
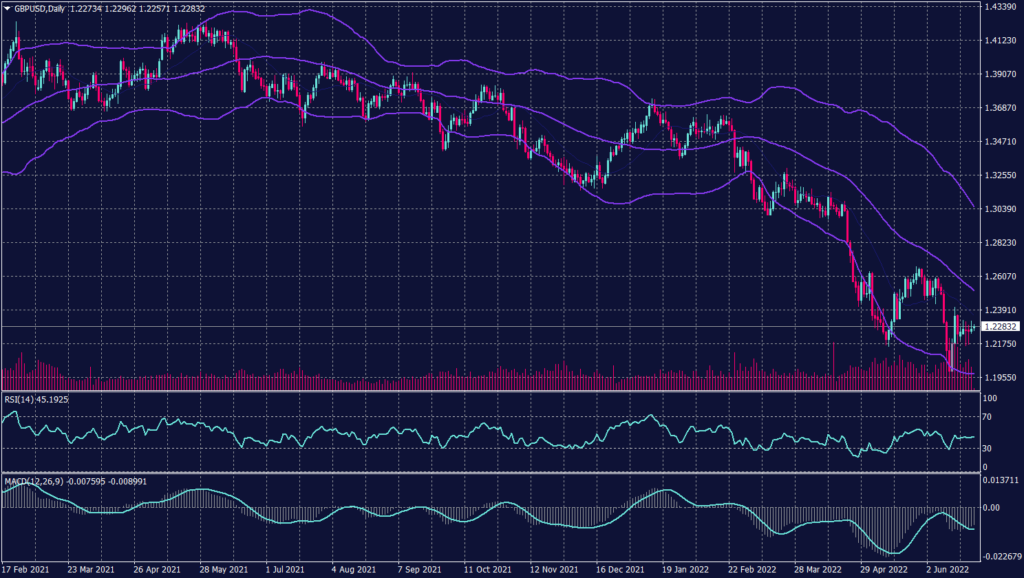
The sterling pound is moving horizontally and shows a cautious trading environment. On the daily chart, the pair remains to weaken and targets its lowest level since March 2020 between 1.1446 and 1.1410. The cable cannot find shelter in the upcoming BOE statement unless it massively exceeded market expectations.
PIVOT POINT:1.2280
| SUPPORT | RESISTANCE |
| 1.1950 | 1.2300 |
| 1.1820 | 1.2380 |
| 1.1700 | 1.2480 |
Spot Gold (XAUUSD)
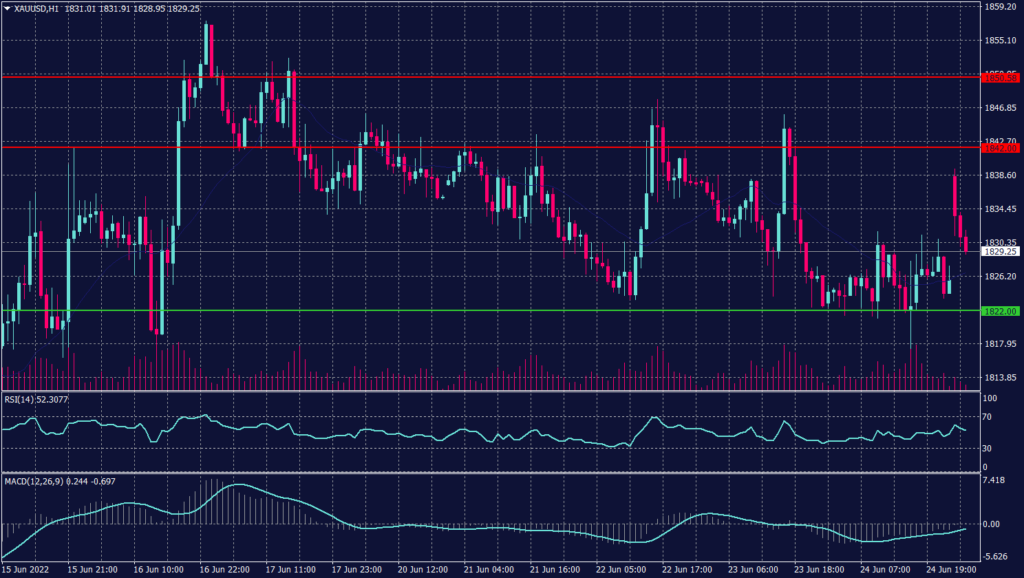
Gold opened in a gap upwards this morning amid news that G-7 countries will impose a ban on Russian gold imports. Furthermore, as market readings are mixed regarding the G-7 meeting, gold prices started to decline from $1,840 to $1,828 during the Asian sessions.
Technically:
Gold is expected to remain strong as long as it is traded above 1,820 and is expected to trade above 1,835 before the European session. The hourly chart shows strong support above 1,820 and signals a possibility of trading above 1,830. Meanwhile, technical indicators are neutral and the 20-period moving average is positive above 1,825.
The daily chart, however, shows a horizontal trend and an increased possibility of a decline between 1,810 and 1,800. Additionally, price action confirms the decline on the daily chart under the condition of breaking below 1,825.
PIVOT POINT: 1,830
| SUPPORT | RESISTANCE |
| 1,815 | 1,842 |
| 1,810 | 1,850 |
| 1,790 | 1,855 |
West Texas Crude (USOUSD)
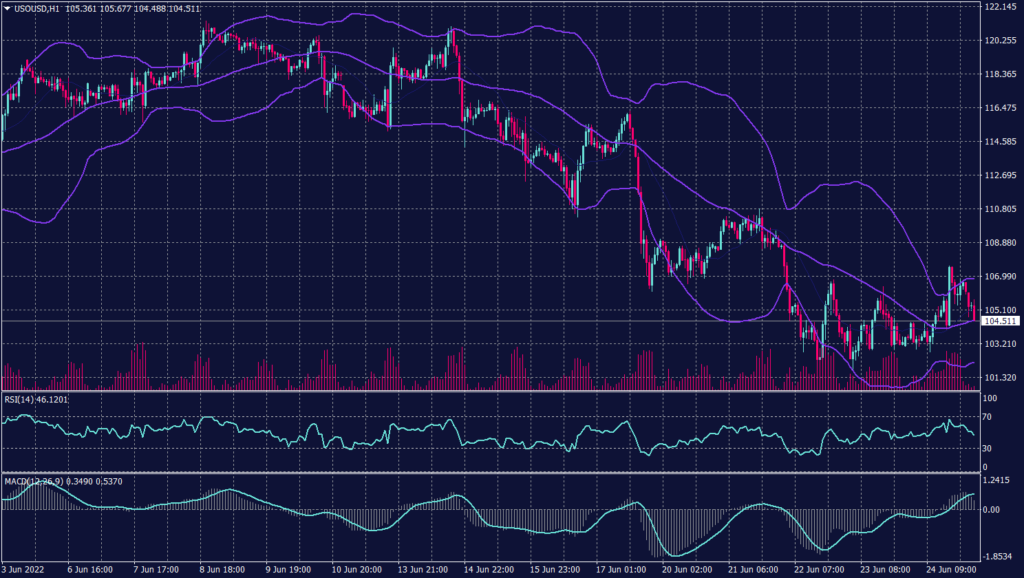
On the hourly chart, WTI prices show an increase in volume traded due to the increase in supply while prices show light support near $104. Meanwhile, the daily chart confirms the decline and targets $98 a barrel after breaking the support at $106.30 yesterday.
PIVOT POINT: 104.40
| SUPPORT | RESISTANCE |
| 102.20 | 108.10 |
| 100.00 | 109.80 |
| 98.00 | 111.00 |
Tags
Open Live Account
Please enter a valid country
No results found
No results found
Please enter a valid email
Please enter a valid verification code
1. 8-16 characters + numbers (0-9) 2. blend of letters (A-Z, a-z) 3. special characters (e.g, !a#S%^&)
Please enter the correct format
Please tick the checkbox to proceed
Please tick the checkbox to proceed
Important Notice
STARTRADER does not accept any applications from Australian residents.
To comply with regulatory requirements, clicking the button will redirect you to the STARTRADER website operated by STARTRADER PRIME GLOBAL PTY LTD (ABN 65 156 005 668), an authorized Australian Financial Services Licence holder (AFSL no. 421210) regulated by the Australian Securities and Investments Commission.
CONTINUEImportant Notice for Residents of the United Arab Emirates
In alignment with local regulatory requirements, individuals residing in the United Arab Emirates are requested to proceed via our dedicated regional platform at startrader.ae, which is operated by STARTRADER Global Financial Consultation & Financial Analysis L.L.C.. This entity is licensed by the UAE Capital Market Authority (CMA) under License No. 20200000241, and is authorised to introduce financial services and promote financial products in the UAE.
Please click the "Continue" button below to be redirected.
CONTINUEError! Please try again.

