


U.S. Dollar Index (USDX)
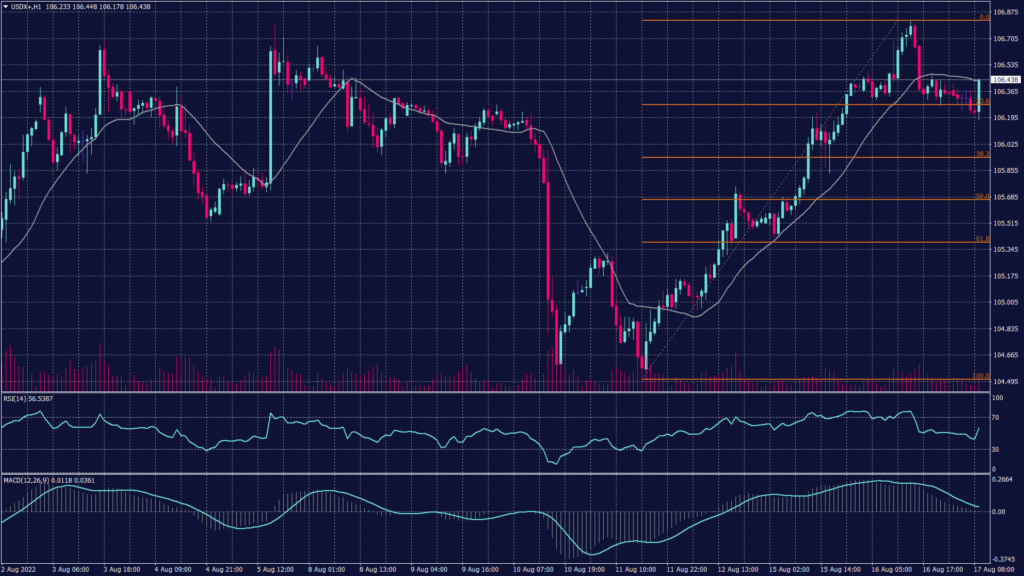
The dollar index traded the majority of the morning sessions below the resistance at 106.50 and slightly above the hourly chart support at 106.30. However, the hourly chart shows a continuation of the uptrend started on August 11 from the previously analyzed double bottom pattern.
Meanwhile, on the daily chart, the index is struggling to penetrate the resistance range of 106.40 and 106.50, which slowed the momentum and flattened the readings of the technical indicators.
PIVOT POINT: 106.50
| SUPPORT | RESISTANCE |
| 106.20 | 106.60 |
| 106.00 | 106.75 |
| 105.50 | 106.95 |
Japanese Yen (USDJPY)
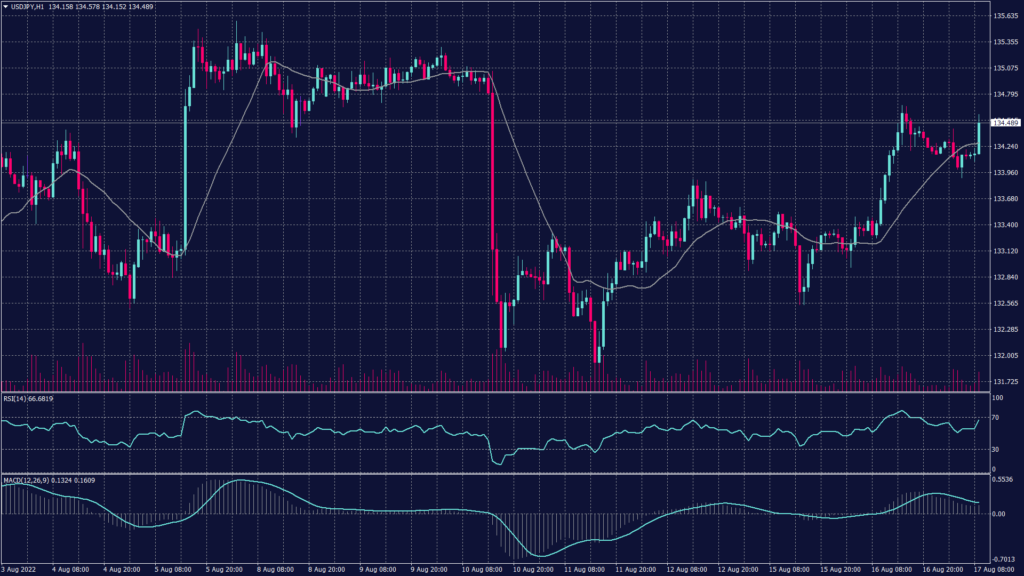
The yen may be tentatively rallying against the dollar, but it is roaring ahead against other major peers in another sign the worst of this year’s losses may be behind it. The samurai currency has climbed over 3% against the dollar to 134.40 since the peak of the bearish trend in mid-July.
However, the pair started recovering by the European session on the hourly chart to light the candle in green. Additionally, the hourly chart shows support at 133.95. Meanwhile, technical indicators show a saturation at the current levels which indicates a possibility of a decline.
PIVOT POINT: 134.70
| SUPPORT | RESISTANCE |
| 134.30 | 135.00 |
| 133.95 | 135.20 |
| 133.60 | 135.35 |
Spot Gold (XAUUSD)
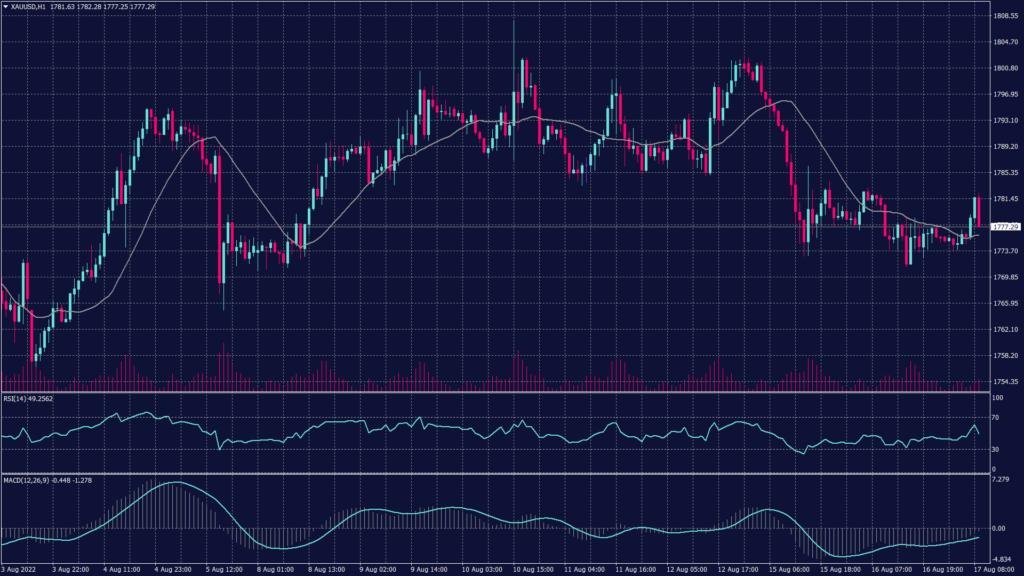
Gold prices moved little in Asian trade on Wednesday as a recovery in the stock market dented safe-haven demand, while copper prices rose on the prospect of more stimulus measures in major importer China. Spot gold prices were largely unchanged at around $1,775.35 an ounce, while gold futures held around $1,789.70 an ounce.
Spot gold found support at 1,770 which kept the trading range tight between 1,772 and 1,782 per ounce. However, the long term trend remains downwards despite the big bounce from 1,700 to 1,775.
PIVOT POINT: 1,775
| SUPPORT | RESISTANCE |
| 1,770 | 1,800 |
| 1,767 | 1,810 |
| 1,759 | 1,825 |
West Texas Crude (USOUSD)
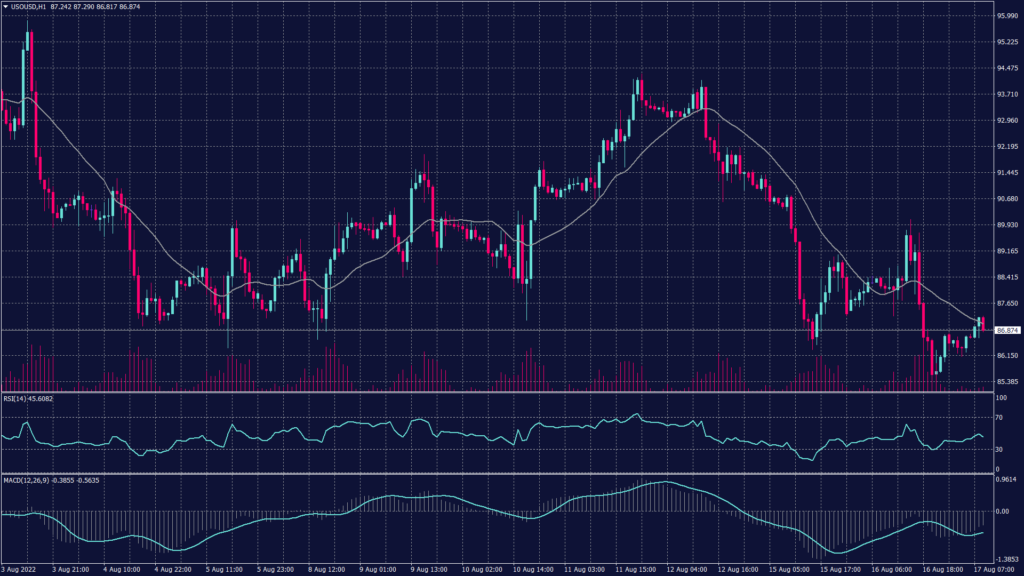
Oil prices rose on Wednesday, recovering from six-month lows hit the previous day, as a larger-than-expected drop in U.S. oil and gasoline stocks reminded investors that demand remains firm if overshadowed by the prospect of a global recession. Brent crude futures rose 0.6% to $92.90 a barrel. WTI crude futures climbed 0.7% to $87.15 a barrel.
The contracts slumped about 3% on Tuesday as weak U.S. housing starts data spurred concerns about a potential global recession. U.S. crude and fuel stocks fell in the latest week, according to market sources citing American Petroleum Institute figures on Tuesday. Crude stocks fell by about 448,000 barrels for the week ended Aug. 12. Gasoline inventories fell by about 4.5 million barrels, while distillate stocks fell by about 759,000 barrels, according to the sources.
WTI found support at $87.40 per barrel on the hourly chart which can be considered a speculative area as long as the prices haven’t dropped below $86.50 per barrel. Meanwhile, the daily chart shows a continuation of the downtrend and a high possibility of breaking towards $82.90.
PIVOT POINT: 86.50
| SUPPORT | RESISTANCE |
| 83.65 | 91.55 |
| 78.85 | 94.00 |
| 74.60 | 97.50 |
Tags
Open Live Account
Please enter a valid country
No results found
No results found
Please enter a valid email
Please enter a valid verification code
1. 8-16 characters + numbers (0-9) 2. blend of letters (A-Z, a-z) 3. special characters (e.g, !a#S%^&)
Please enter the correct format
Please tick the checkbox to proceed
Please tick the checkbox to proceed
Important Notice
STARTRADER does not accept any applications from Australian residents.
To comply with regulatory requirements, clicking the button will redirect you to the STARTRADER website operated by STARTRADER PRIME GLOBAL PTY LTD (ABN 65 156 005 668), an authorized Australian Financial Services Licence holder (AFSL no. 421210) regulated by the Australian Securities and Investments Commission.
CONTINUEImportant Notice for Residents of the United Arab Emirates
In alignment with local regulatory requirements, individuals residing in the United Arab Emirates are requested to proceed via our dedicated regional platform at startrader.ae, which is operated by STARTRADER Global Financial Consultation & Financial Analysis L.L.C.. This entity is licensed by the UAE Capital Market Authority (CMA) under License No. 20200000241, and is authorised to introduce financial services and promote financial products in the UAE.
Please click the "Continue" button below to be redirected.
CONTINUEError! Please try again.

