


market news summary
99.7% of investors expect a 75 bp hike;
Gold hovers around a month low;
Crude oil declined but remains bullish;
Crude demand is expected to spike.
U.S. Dollar Index (USDX)
The dollar held near its overnight 20-year peak on Wednesday ahead of the outcome of the Federal Reserve policy meeting at which markets are pricing in an outsized 75 basis point hike.
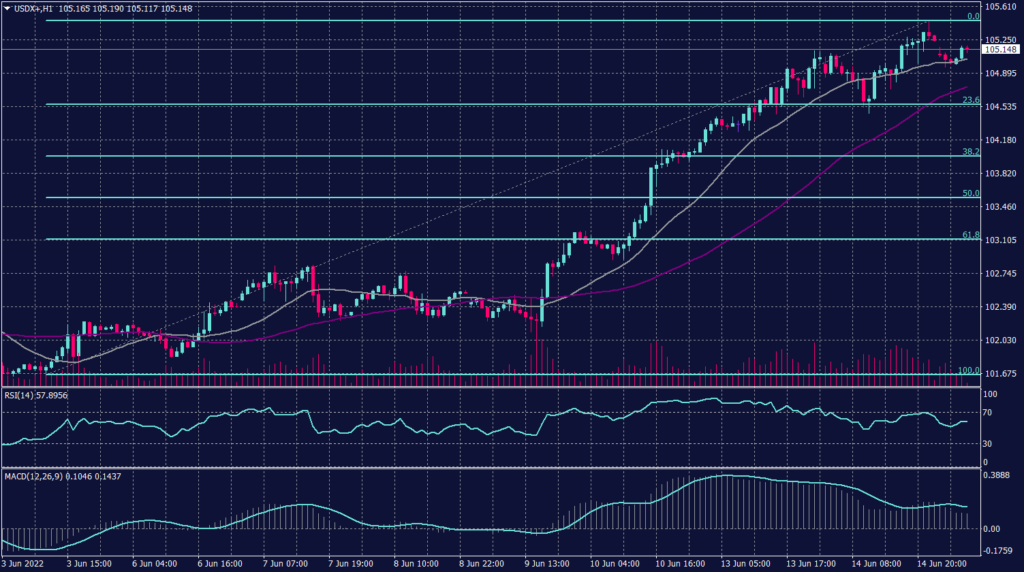
The key U.S. currency index was at 105.3 this morning after it hit its strongest since December 2002 at 105.65 on Tuesday. Market pricing indicates a 99.7% chance of a 75 basis point rate hike at the Fed’s meeting which concludes later today, according to the CME’s Fedwatch tool, up from only 3.9% a week ago.
Technically:
The U.S. Dollar index hit the resistance at 105.13 to record the highest level in 20 years before retreating to 104.60 this morning. On the hourly chart, Fibonacci retracement shows a solid resistance at 105.10 and indicates a retreat towards 104.30-104.35. However, technical indicators on the hourly chart show more decline during the day.
On the daily chart, 20 and 55 periods moving averages indicate further advancement and support above 102.30 for the longer time frames. However, RSI signals a correction decline while the MACD shows a possibility of reaching new highs above 105.60.
PIVOT POINT: 104.80
| SUPPORT | RESISTANCE |
| 104.60 | 105.10 |
| 103.50 | 105.60 |
| 102.60 | 105.80 |
Japanese Yen (USDJPY)
The BOJ offered to ramp up bond buying for a range of maturities on Wednesday, after spending roughly 3 trillion yen ($22.21 billion) in purchases on Tuesday to defend its 0.25% cap for 10-year Japanese government bonds. BOJ Governor Haruhiko Kuroda has repeatedly stressed the need to keep monetary policy ultra-loose and said the central bank will not target exchange rates in guiding monetary policy.
Technically:
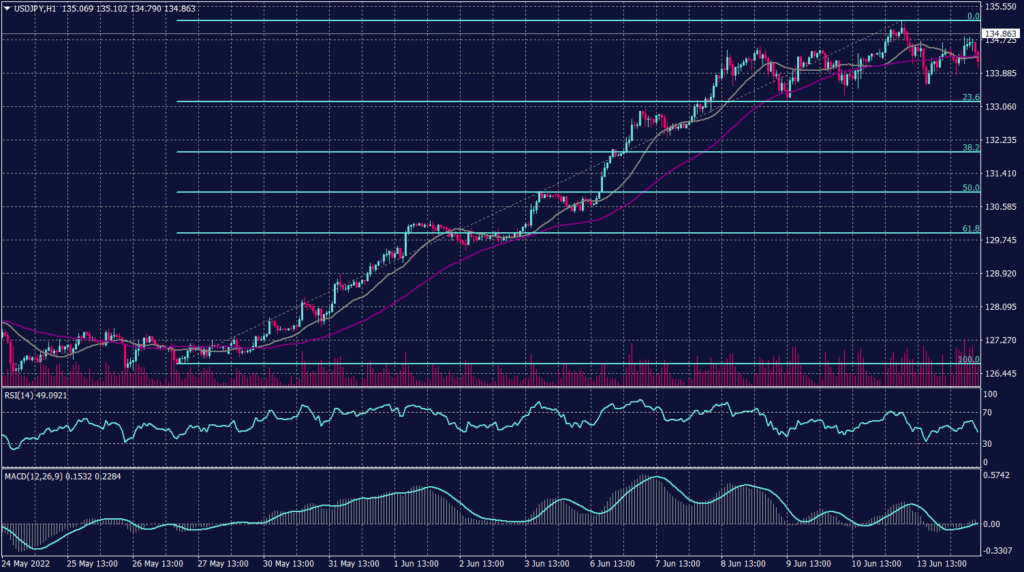
USDJPY pair has reached a fresh 20-year high at 135.19 during the early trades amid huge yen selling activities. The hourly chart shows resistance at the current levels, but the moving averages indicate further advance and support above 134.00.
Technical indicators on the hourly chart show a slight retreat towards 134.35, while it shows a strong advance possibility on the daily chart.
PIVOT POINT: 134.60
| SUPPORT | RESISTANCE |
| 134.30 | 135.00 |
| 133.90 | 135.20 |
| 133.30 | 135.30 |
Spot Gold (XAUUSD)
Gold was up this morning during the Asian sessions, but it remained near four weeks lows as Treasury yields weakened. ahead of the U.S. Federal Reserve meeting which is expected to announce aggressive interest rate hikes to tame high inflation.
Benchmark U.S. 10-year Treasury yields eased from a multi-year peak, ahead of the U.S. Fed meeting. Although the Fed indirectly confirmed the 75 bp hike, a slight percentage of market participants expect 100 bp.
Technically:
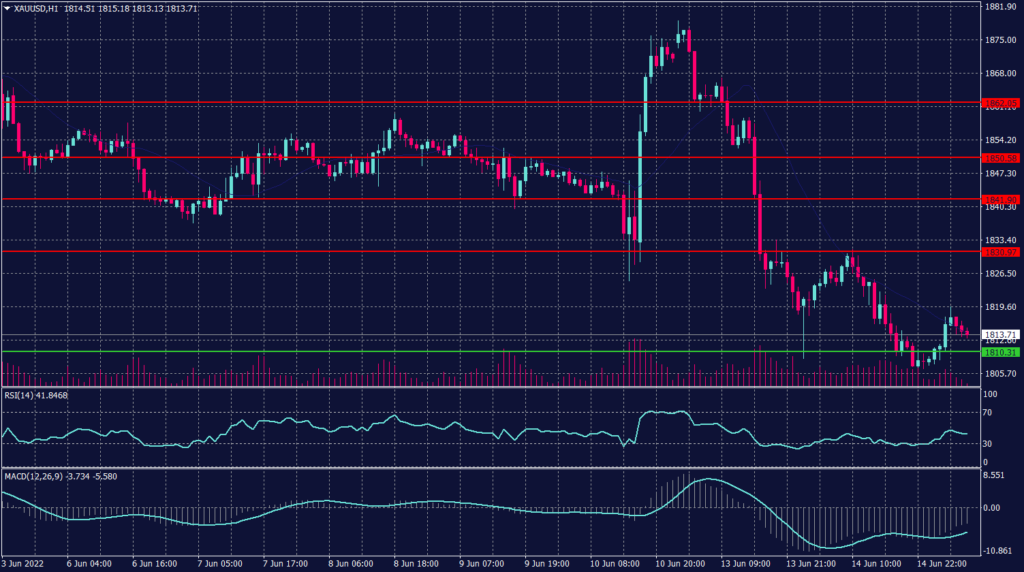
Gold edged up 0.16% near $1,818 this morning above the previously mentioned support at $1,810. The hourly chart shows that $1,830 is now resistance and will push the precious metal below $1,810.
Meanwhile, the daily chart shows a possibility that gold will hover above $1,810 under heavy selling pressure. However, technical indicators and volume measures indicate a further decline on the daily chart targeting $1,790 per ounce.
PIVOT POINT: 1,818
| SUPPORT | RESISTANCE |
| 1,815 | 1,842 |
| 1,810 | 1,850 |
| 1,790 | 1,855 |
West Texas Crude (USOUSD)
Official data showed that China’s industrial production increased 0.7% in May year-on-year, which was better than market expectations. The April reading was a 2.9% decline.
Oil prices made gains on Wednesday, rebounding from losses earlier in the session amid concerns over fuel demand and the broader economy ahead of an expected big hike in interest rates by the U.S. Federal Reserve.
Tuesday’s U.S. crude supply data from the American Petroleum Institute showed a build of 0.736 million barrels for the week ended June 10. OPEC+ stuck to its forecast that world oil demand will exceed pre-pandemic levels in 2022 in its monthly report. Furthermore, Brent crude futures were up 0.1% at $121.32 while WTI futures rose 0.1% to $119.08.
Technically:
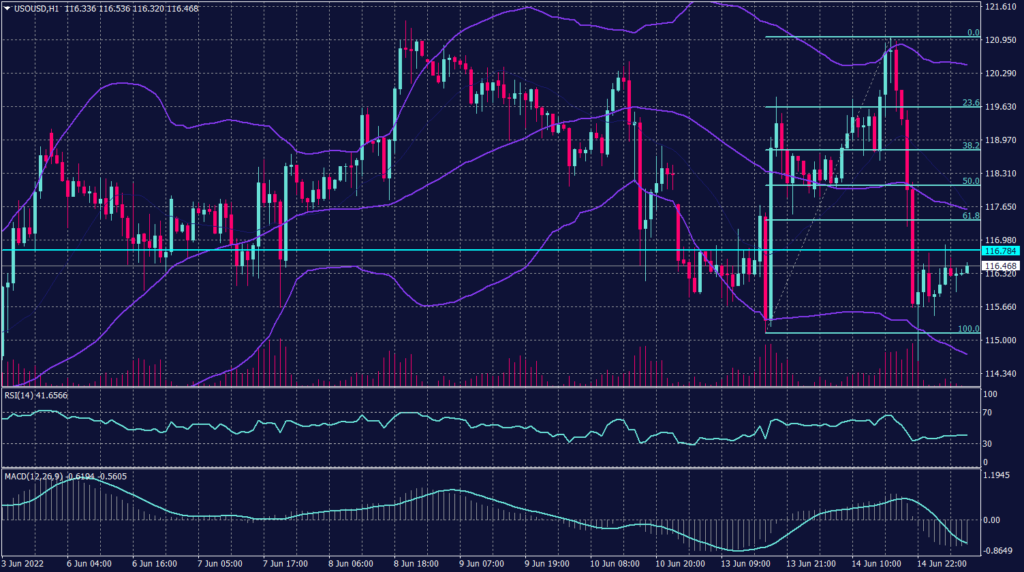
WTI fell hard yesterday amid the supply data, but it bounced as the Chinese data was released. However, WTI remains bullish on the daily chart while cementing the support above $115 as per the 55 moving average readings.
PIVOT POINT: 116.00
| SUPPORT | RESISTANCE |
| 115.00 | 118.00 |
| 112.00 | 119.60 |
| 110.00 | 123.00 |
Tags
Open Live Account
Please enter a valid country
No results found
No results found
Please enter a valid email
Please enter a valid verification code
1. 8-16 characters + numbers (0-9) 2. blend of letters (A-Z, a-z) 3. special characters (e.g, !a#S%^&)
Please enter the correct format
Please tick the checkbox to proceed
Please tick the checkbox to proceed
Important Notice
STARTRADER does not accept any applications from Australian residents.
To comply with regulatory requirements, clicking the button will redirect you to the STARTRADER website operated by STARTRADER PRIME GLOBAL PTY LTD (ABN 65 156 005 668), an authorized Australian Financial Services Licence holder (AFSL no. 421210) regulated by the Australian Securities and Investments Commission.
CONTINUEImportant Notice for Residents of the United Arab Emirates
In alignment with local regulatory requirements, individuals residing in the United Arab Emirates are requested to proceed via our dedicated regional platform at startrader.ae, which is operated by STARTRADER Global Financial Consultation & Financial Analysis L.L.C.. This entity is licensed by the UAE Capital Market Authority (CMA) under License No. 20200000241, and is authorised to introduce financial services and promote financial products in the UAE.
Please click the "Continue" button below to be redirected.
CONTINUEError! Please try again.

