


Market news summary
Investors embrace for 75 bp Fed hike;
BOE is expected to hike 50 bp;
Eurozone inflation rise;
Gold at four weeks low;
Crude oil continued to rise.
U.S. Dollar Index (USDX)
The U.S. dollar carried a fresh 20-year peak on Tuesday as investors braced for aggressive Federal Reserve rate hikes and a possible recession. In the meantime, markets have sped to bet on rapid hikes to face the unexpectedly sizzling inflation reading on Friday.
However, consecutive 75 basis point rate rises in June and July are close to fully priced, sending shockwaves across asset classes. The dollar has gained with yields and as investors seek shelter from the storm. The dollar index scaled a two-decade peak of 105.29 on Monday and held at that level in Asia.
Technically:
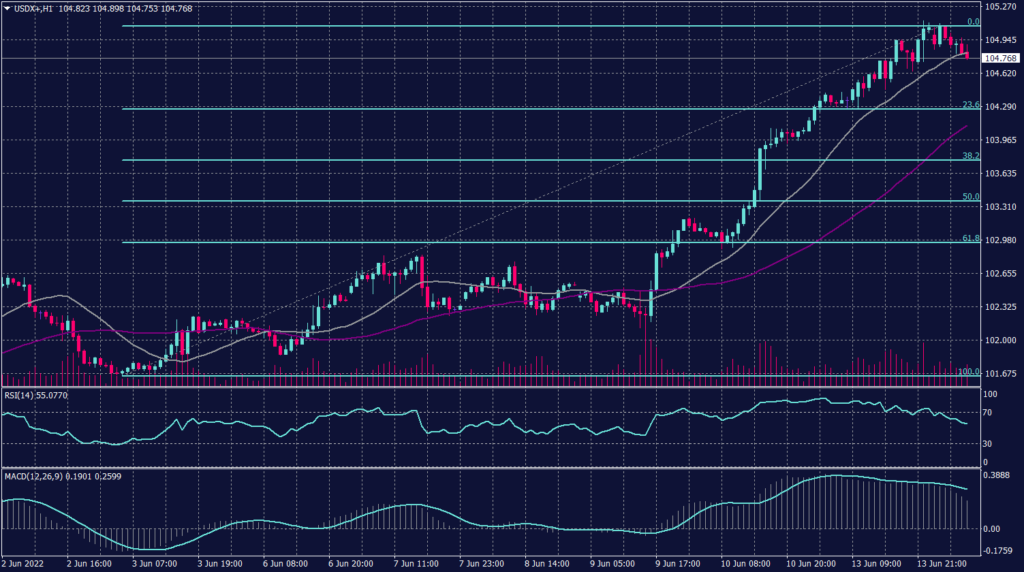
The U.S. Dollar index hit the resistance at 105.13 to record the highest level in 20 years before retreating to 104.60 this morning. On the hourly chart, Fibonacci retracement shows a solid resistance at 105.10 and indicates a retreat towards 104.30-104.35. However, technical indicators on the hourly chart show more decline during the day.
On the daily chart, 20 and 55 periods moving averages indicate further advancement and support above 102.30 for the longer time frames. However, RSI signals a correction decline while the MACD shows a possibility of reaching new highs above 105.60.
PIVOT POINT: 104.60
| SUPPORT | RESISTANCE |
| 104.00 | 104.80 |
| 103.50 | 105.10 |
| 102.60 | 105.60 |
Euro (EURUSD)
The European Central Bank (ECB) affirmed that it intends to start its rate hiking cycle in July and suggested that another increase in September will depend on the inflation data over the summer.
Meanwhile, German consumer prices rose 0.9% in May, after a gain of 0.8% the previous month. However, the annual figure climbed to 7.9%, from 7.4% in April, suggesting that the ECB has its work cut out controlling inflation in the Eurozone’s largest economy.
Other data due for release Tuesday includes Eurozone industrial production data for April and Germany’s ZEW index of economic sentiment for June.
Technically:
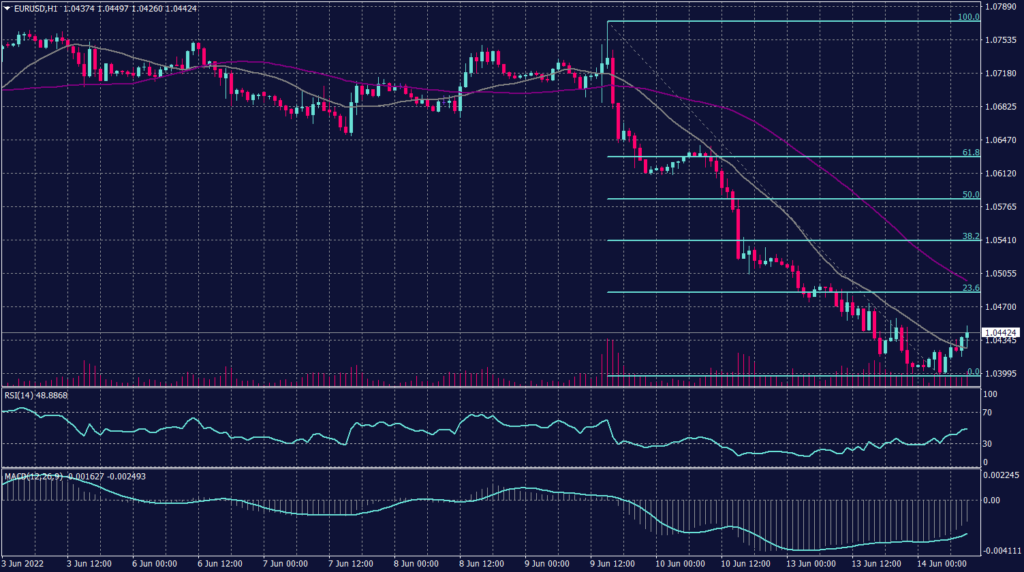
The EURUSD remains aggressively bearish on both intraday time frames and long-term charts. However, the hourly chart shows a slight corrective movement intraday but remains inside the declining channel. Also, the hourly chart is not showing support below the bottom at 1.0400 until 1.0360.
The Daily time frame shows resistance at 1.0400 but confirms the readings from the shorter time frames. However, the price trend is targeting the lowest since 2002 near 1.0300.
PIVOT POINT: 1.0400
| SUPPORT | RESISTANCE |
| 1.0360 | 1.0470 |
| 1.0300 | 1.0510 |
| 1.0270 | 1.0570 |
Sterling Pound (GBPUSD)
The Bank of England meets on Thursday and is expected to continue its cycle of rate hikes despite Monday’s data showing a contraction in the country’s GDP in April.
Data released showed another fall in the U.K. claimant count of 19,700 in May, but April’s average earnings (including bonuses) soared 6.8%, illustrating the dilemma the central bank is under.
Technically:
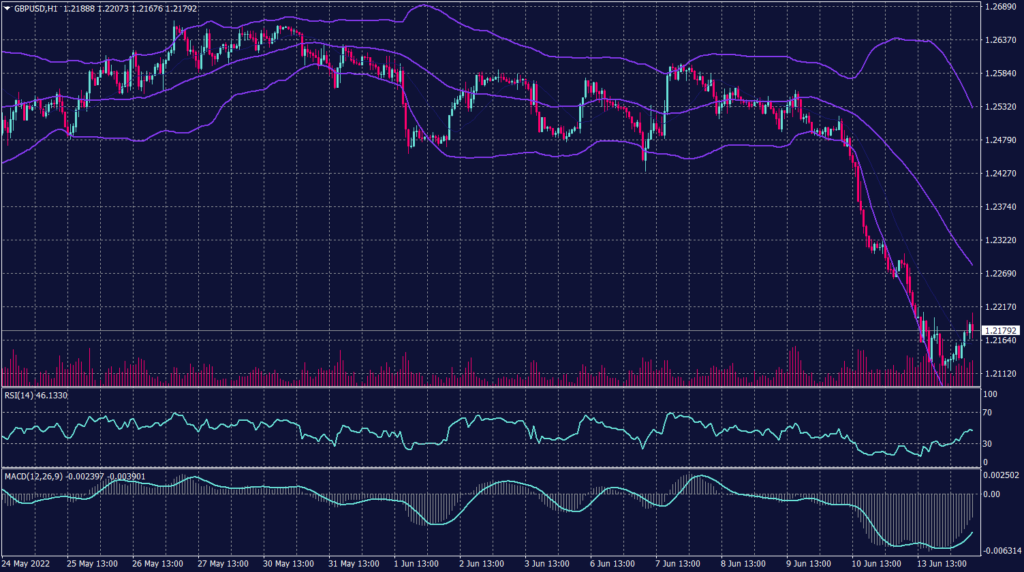
The cable is showing a slight bounce on the hourly chart from the lower band of the Bollinger Bands while RSI and MACD signal an uptrend. On the Daily chart, the GBPUSD pair is moving below the 55 period moving average indicating a further decline.
PIVOT POINT: 1.2170
| SUPPORT | RESISTANCE |
| 1.2140 | 1.2200 |
| 1.2100 | 1.2245 |
| 1.1800 | 1.2300 |
Japanese Yen (USDJPY)
The BOJ increased bond-purchase operations to keep yields in check. Meanwhile, the yen dipped near a 24-year low against the greenback.
The Bank of Japan (BOJ) will hand down its policy decisions on Friday. As the yen fell to 24-year lows to the dollar, Japanese Finance Minister Shunichi Suzuki reiterated on Tuesday the government will coordinate with the BOJ.
Technically:
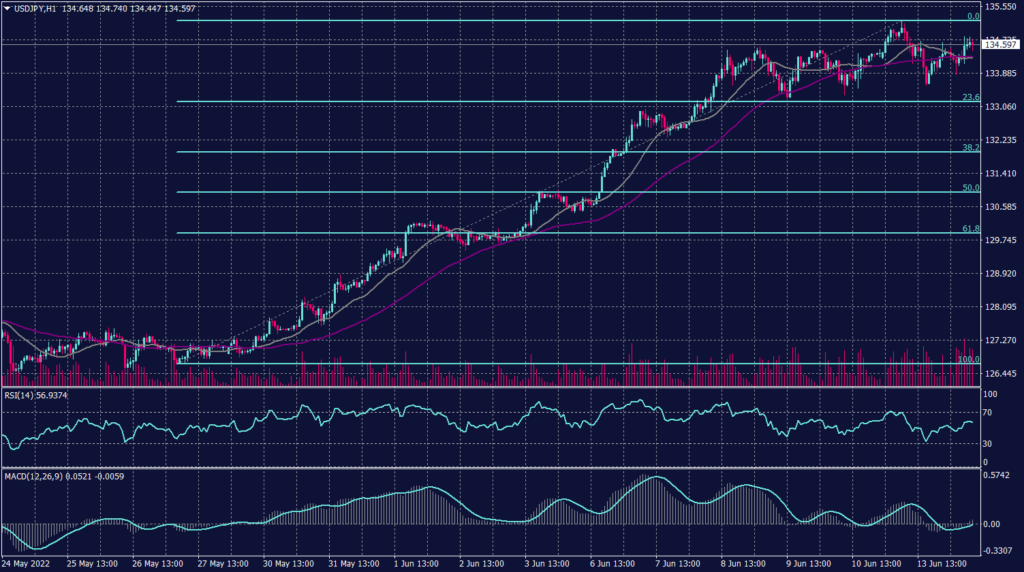
USDJPY pair has reached a fresh 20-year high at 135.19 during the early trades amid huge yen selling activities. The hourly chart shows resistance at the current levels, but the moving averages indicate further advance and support above 134.00.
Technical indicators on the hourly chart show a slight retreat towards 134.35, while it shows a strong advance possibility on the daily chart.
PIVOT POINT: 134.60
| SUPPORT | RESISTANCE |
| 134.30 | 135.00 |
| 133.90 | 135.20 |
| 133.30 | 135.30 |
Spot Gold (XAUUSD)
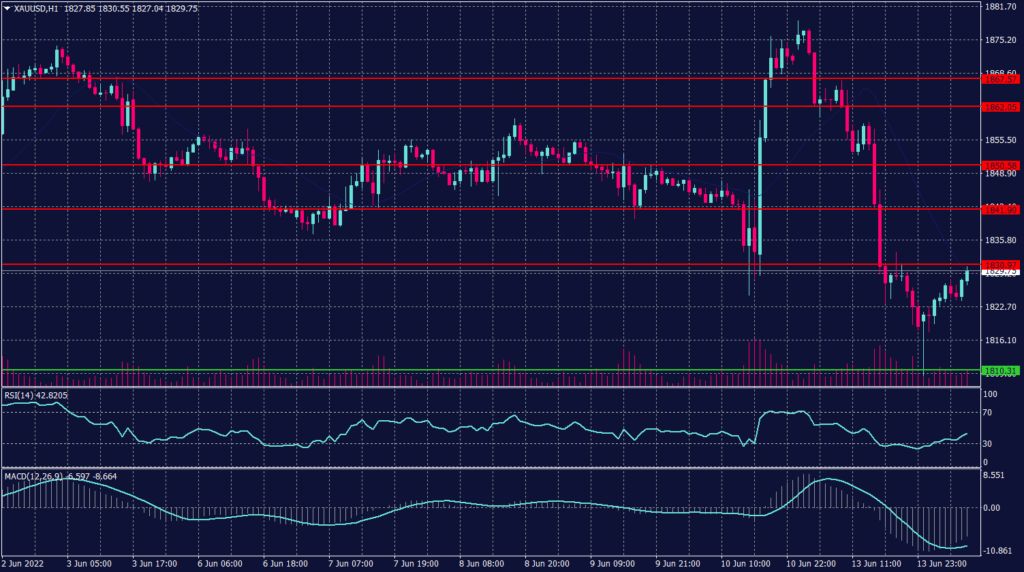
Gold was down on Tuesday morning in Asia and traded near a four-week low. Meanwhile, Wall Street officially entered a bear market as investors are worried about a recession caused by more aggressive interest rate hikes from the U.S. Federal Reserve.
Experts forecast a 75-basis point (bp) interest rate hike in the June policy meeting on Wednesday, which would be the biggest since 1994.
Technically:
The yellow metal declined below the support of $1,830 touching the previous target at $1,810 per ounce before bouncing back towards $1,825. The hourly chart shows that $1,830 is now resistance and will push the precious metal below $1,810.
Meanwhile, the daily chart shows a possibility that gold will hover above $1,810 under heavy selling pressure. However, technical indicators and volume measures indicate a further decline on the daily chart targeting $1,790 per ounce.
PIVOT POINT: 1,830
| SUPPORT | RESISTANCE |
| 1,825 | 1,842 |
| 1,810 | 1,850 |
| 1,790 | 1,855 |
West Texas Crude (USOUSD)
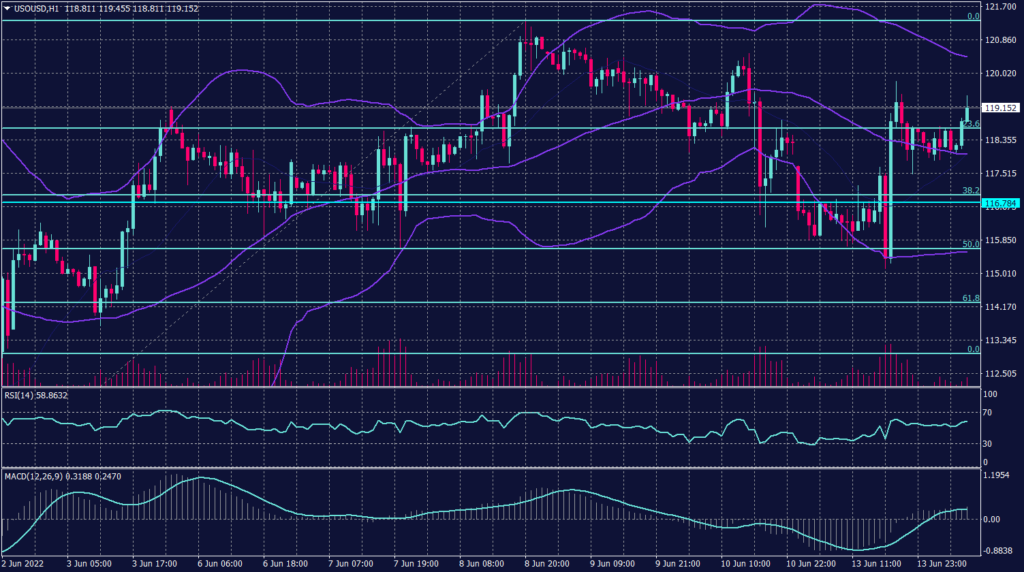
Oil markets started to recover late in the Asian session as WTI traded 0.13% up at $121.08 per barrel while Brent crude firmed slightly to $122.42 per barrel.
China’s resumption of COVID-19 curbs such as partial lockdowns in Shanghai also added to worries that it might dent oil demand. Libya’s exports dropped amid a political crisis that has hit output and ports spurred worries of tightness in supply.
Other producers in the Organization of the Petroleum Exporting Countries and allies (OPEC+) struggle to meet their output missions while Russia faces bans on its oil over the war in Ukraine. Investors now await U.S. crude supply data from the American Petroleum Institute, due later in the day.
Technically:
WTI remains in the uptrend on the daily chart while forming support above $118 as per the 55 moving average readings. However, WTI is likely to gain towards $120 a barrel, while Fibonacci retracement shows firm support at 118.75.
PIVOT POINT: 119.00
| SUPPORT | RESISTANCE |
| 118.75 | 120.00 |
| 118.00 | 122.00 |
| 116.50 | 123.00 |
Tags
Open Live Account
Please enter a valid country
No results found
No results found
Please enter a valid email
Please enter a valid verification code
1. 8-16 characters + numbers (0-9) 2. blend of letters (A-Z, a-z) 3. special characters (e.g, !a#S%^&)
Please enter the correct format
Please tick the checkbox to proceed
Please tick the checkbox to proceed
Important Notice
STARTRADER does not accept any applications from Australian residents.
To comply with regulatory requirements, clicking the button will redirect you to the STARTRADER website operated by STARTRADER PRIME GLOBAL PTY LTD (ABN 65 156 005 668), an authorized Australian Financial Services Licence holder (AFSL no. 421210) regulated by the Australian Securities and Investments Commission.
CONTINUEImportant Notice for Residents of the United Arab Emirates
In alignment with local regulatory requirements, individuals residing in the United Arab Emirates are requested to proceed via our dedicated regional platform at startrader.ae, which is operated by STARTRADER Global Financial Consultation & Financial Analysis L.L.C.. This entity is licensed by the UAE Capital Market Authority (CMA) under License No. 20200000241, and is authorised to introduce financial services and promote financial products in the UAE.
Please click the "Continue" button below to be redirected.
CONTINUEError! Please try again.

