


market news summary
U.S. Dollar on two decades high;
Euro trading at the lowest since 2017;
BTC is the lowest since Nov 2021;
USDX above 104.
U.S. Dollar Index (USDX)
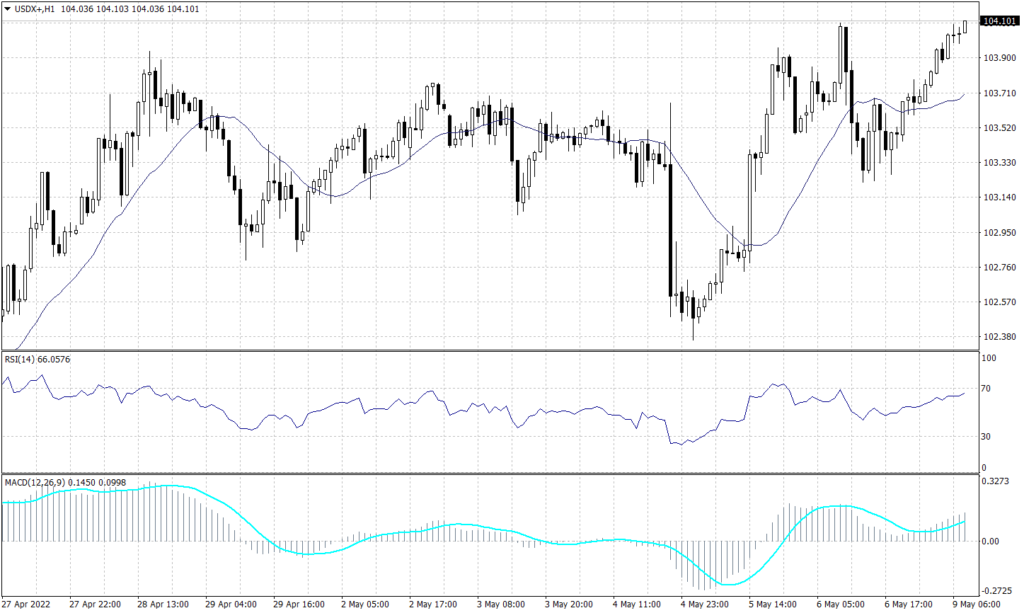
The dollar hit a two-decade high on Monday as investors searched for safety and yield due to growing concerns over slowing global economic growth and rising interest rates. The U.S. Dollar index faced a hard time breaking above 103.60 before the Non-Farm Payroll data, while the USDX rebounded to trade above 104 during the Asian trades today.
Technically, the index established strong support above 103.40 on the daily chart but price action kept the possibility of a decline towards 102.65. However, on the hourly chart, technical indicators and trend lines expect the index to trade between 103.7 and 104.10 during the day.
PIVOT POINT: 104.00
| R1 | R2 | R3 | |
| RESISTANCE | 104.10 | 104.30 | 104.60 |
| S1 | S2 | S3 | |
| SUPPORT | 103.70 | 103.60 | 102.70 |
Euro (EURUSD)
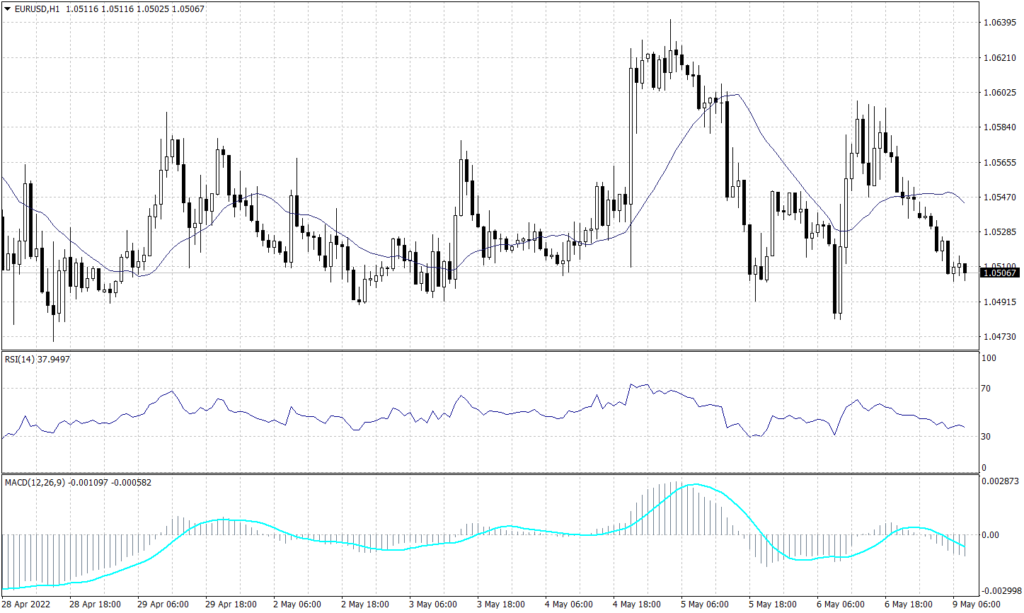
The common currency remains on the primary downtrend, but it found sanctuary support around 1.0510. Furthermore, the pair is unlikely to change direction based on the current price action and, it might break towards 1.0490 during the day.
Technical indicators signal a continuation towards 1.04925. Meanwhile, in the longer term, the pair is set to continue its primary downtrend.
PIVOT POINT: 1.0510
| R1 | R2 | R3 | |
| RESISTANCE | 1.0650 | 1.0675 | 1.0730 |
| S1 | S2 | S3 | |
| SUPPORT | 1.0490 | 1.0410 | 1.0350 |
Sterling Pounds (GBPUSD)
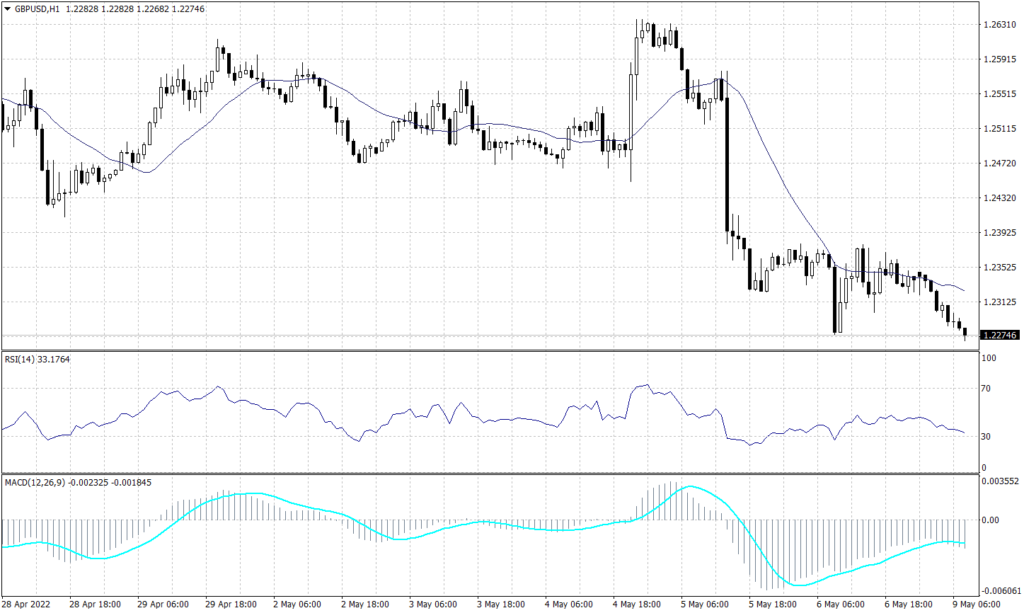
The sterling pound lost ground against the U.S. dollar this morning and broke below the support of 1.2300 on the hourly chart to trade around 1.2270. On the daily chart, the Cable is set to continue the primary decline to touch its lowest rate since May 2020 below 1.2100.
On the daily chart, the pair is expected to fall to 1.2070, while the hourly chart shows a likelihood to trade around 1.2000 during the day. The RSI and MACD are showing signals for a further decline in a slow fashion, while price action retains the reading of 1.2100 during the day.
PIVOT POINT: 1.2270
| R1 | R2 | R3 | |
| RESISTANCE | 1.2400 | 1.2565 | 1.2690 |
| S1 | S2 | S3 | |
| SUPPORT | 1.2070 | 1.1980 | 1.1900 |
Japanese Yen (USDJPY)
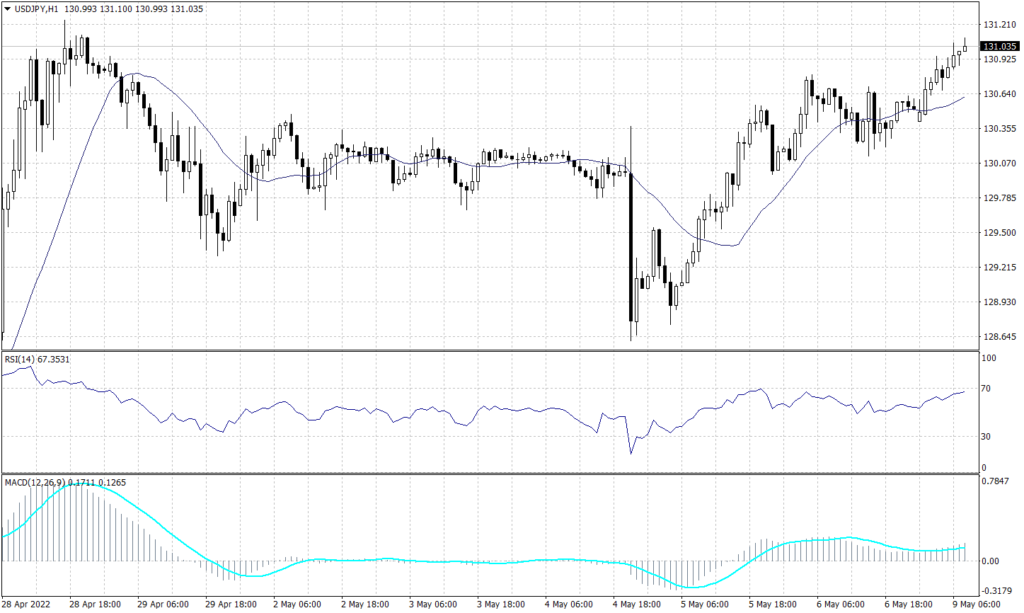
The Japanese yen was weaker against the greenback and traded above 131 during the early trades. The USDJPY pair closed above the resistance of 130 on Friday and traded higher after the opening of the Asian session.
The primary trend remains upwards targeting 132. The pair retains the bullish trend on the hourly chart despite yesterday’s fall and is supported above the broken resistance of 130. Technical indicators imply that prices are likely to hover between 130.60 and 131.50.
PIVOT POINT: 131.10
| R1 | R2 | R3 | |
| RESISTANCE | 131.30 | 132.00 | 132.40 |
| S1 | S2 | S3 | |
| SUPPORT | 130.60 | 128.70 | 128.35 |
Spot Gold (XAUUSD)
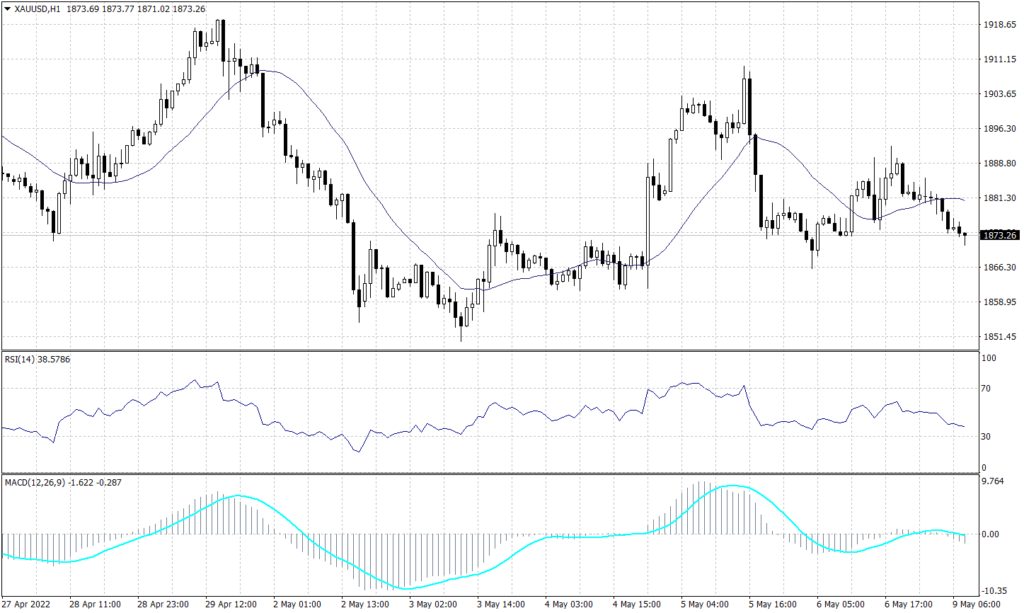
The precious metal traded at 1,873 during the early trades benefiting from the slight decrease in market sentiment. Gold prices retain their negative trend on the daily chart, but it is likely to continue the long-term downward trend.
The daily chart shows a continuation of the bearish trend line targeting the range between 1,825 to 1,800. Meanwhile, the hourly chart shows gold in a light volume area, which indicates to touch 1,855. Furthermore, both the RSI and the MACD imply that the bearish trend will continue.
PIVOT POINT: 1,875
| R1 | R2 | R3 | |
| RESISTANCE | 1,890 | 1,895 | 1,905 |
| S1 | S2 | S3 | |
| SUPPORT | 1,855 | 1,825 | 1,800 |
WTI (USOUSD)
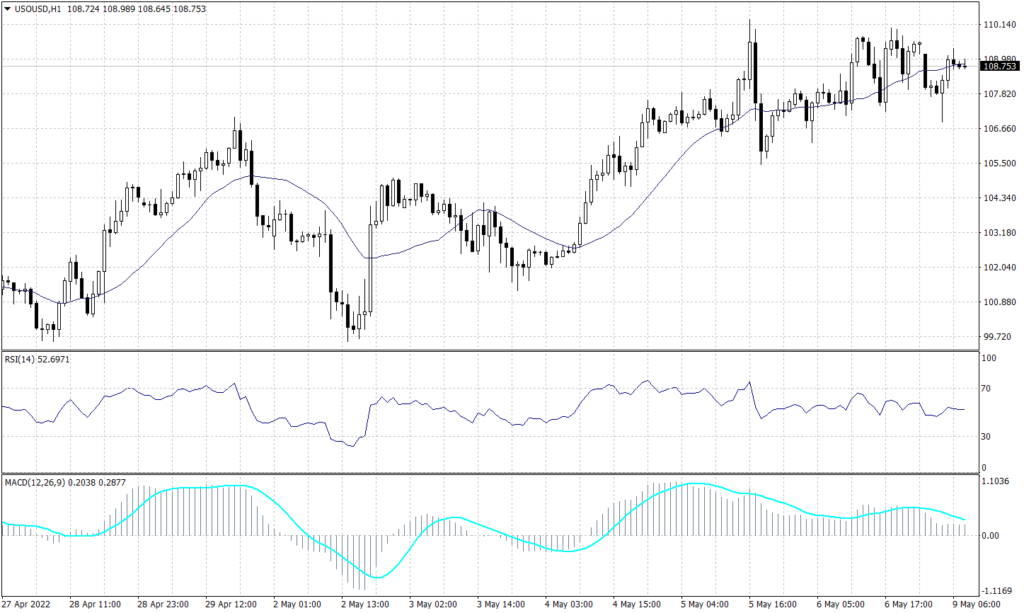
West Texas Intermediate crude traded above 108.50 pushed by the Eurozone sanctions on Russia. However, WTI price action indicates a further advance to $109 and $110 on the hourly chart and signals support above $107.80.
MACD and RSI are taking a neutral stance but retain the possibility to drop towards $105.25 a barrel. While Moving Average is moving at the same level, the price action indicates a possibility to hover around the current levels.
PIVOT POINT: 108.70
| R1 | R2 | R3 | |
| RESISTANCE | 108.40 | 110.00 | 111.20 |
| S1 | S2 | S3 | |
| SUPPORT | 107.80 | 106.00 | 105.25 |
Bitcoin (BTCUSD)
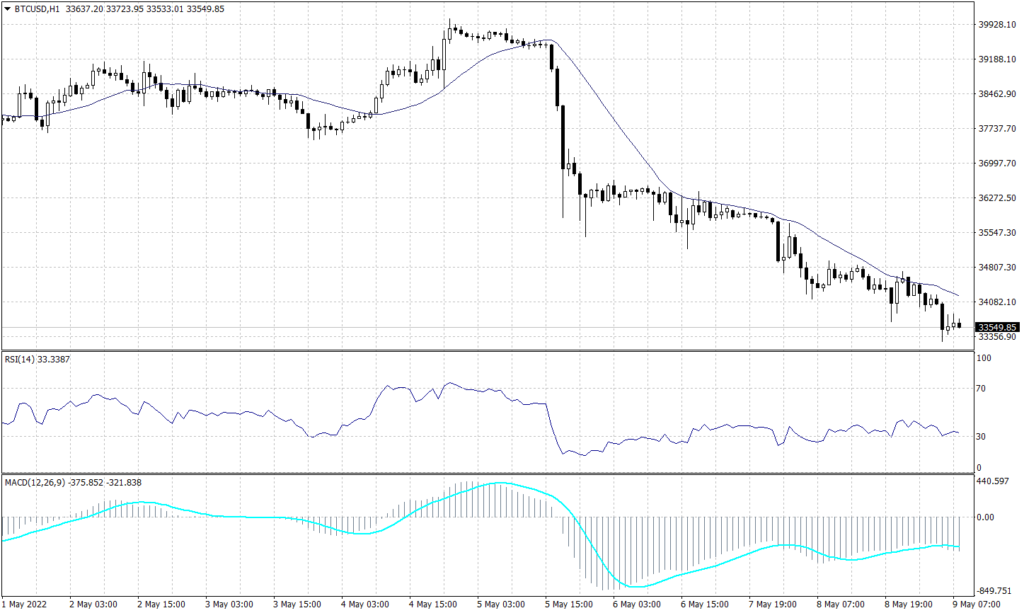
On Monday, Bitcoin fell to its lowest level since January to as low as $33,266, testing the January low of $32,951. A fall below that level would be its lowest since July last year. The Crypto flagship is not showing signs of recovery after breaking below 34,080, but it might slow the drop as investors will start seeking alternative safe assets.
Technically, MACD and RSI are showing a slowdown in the trend but the moving average signals more decline.
PIVOT POINT: 33,550
| R1 | R2 | R3 | |
| RESISTANCE | 34,080 | 34,800 | 35,550 |
| S1 | S2 | S3 | |
| SUPPORT | 33,310 | 33,000 | 32,650 |
Tags
Open Live Account
Please enter a valid country
No results found
No results found
Please enter a valid email
Please enter a valid verification code
1. 8-16 characters + numbers (0-9) 2. blend of letters (A-Z, a-z) 3. special characters (e.g, !a#S%^&)
Please enter the correct format
Please tick the checkbox to proceed
Please tick the checkbox to proceed
Important Notice
STARTRADER does not accept any applications from Australian residents.
To comply with regulatory requirements, clicking the button will redirect you to the STARTRADER website operated by STARTRADER PRIME GLOBAL PTY LTD (ABN 65 156 005 668), an authorized Australian Financial Services Licence holder (AFSL no. 421210) regulated by the Australian Securities and Investments Commission.
CONTINUEImportant Notice for Residents of the United Arab Emirates
In alignment with local regulatory requirements, individuals residing in the United Arab Emirates are requested to proceed via our dedicated regional platform at startrader.ae, which is operated by STARTRADER Global Financial Consultation & Financial Analysis L.L.C.. This entity is licensed by the UAE Capital Market Authority (CMA) under License No. 20200000241, and is authorised to introduce financial services and promote financial products in the UAE.
Please click the "Continue" button below to be redirected.
CONTINUEError! Please try again.

