


Market news summary
Euro remains weak;
The crude oil trend is indecisive;
Gold will react to FOMC meeting;
Bitcoin is temporarily safe.
U.S. Dollar Index (USDX)
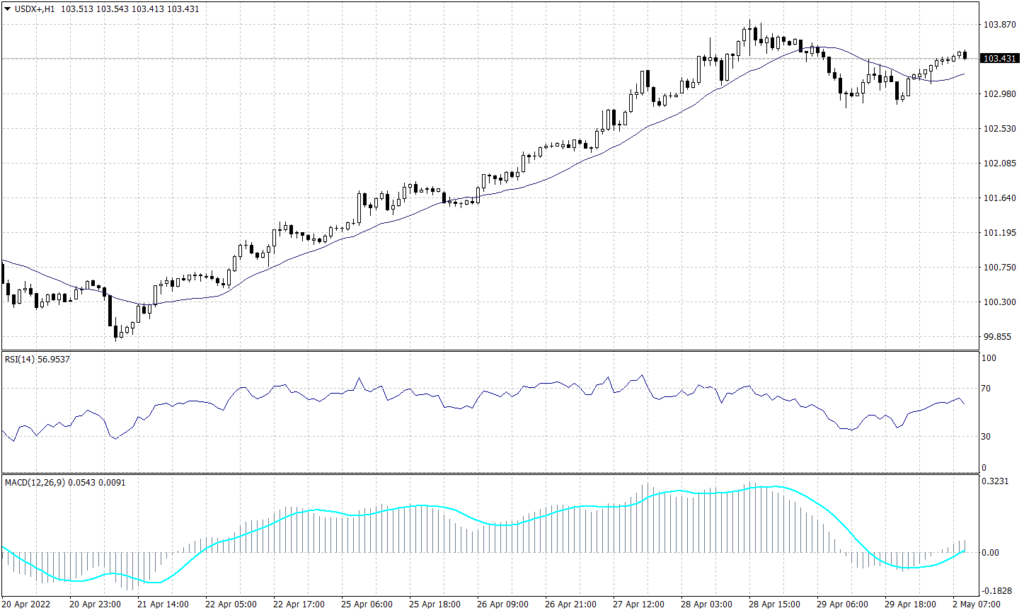
The U.S. Dollar traded slightly below 103.50 near its all-time high slightly at 103.90. The index is strongly supported above the tight range between 103 and 103.20, indicating that it remains in an optimistic trend. As mentioned last week the price is expected to trade around the range of 103.50 for the week due to the volume traded and reactive trading.
Meanwhile, the trend will keep trading in a slow pattern until it breaks above 104 for a new high or below 103 for a reversal trend towards 101.10. Technical indicators like the RSI and MACD, on the other hand, continue to show prices moving upward.
PIVOT POINT: 103.50
| R1 | R2 | R3 | |
| RESISTANCE | 103.80 | 104.00 | |
| S1 | S2 | S3 | |
| SUPPORT | 103.10 | 102.80 |
Euro (EURUSD)
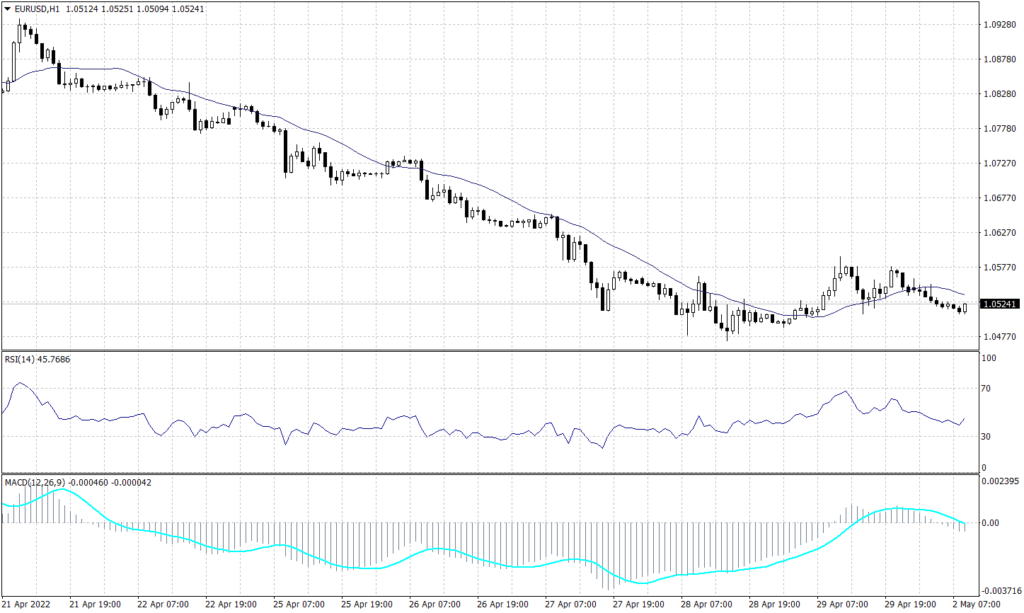
The Euro remains near its five years low despite the short swings to 1.0577 and it keeps the downtrend on the daily chart as well as the hourly chart. In the short term, for the EURUSD to bounce up the prices should break above 1.0580, while in the long term it might show a slight sign of recovery if it broke above the resistance range between 1.0800 and 1.0940. As the technical indicators show stability around the current levels, while price action indicates a probability to drop further.
PIVOT POINT: 1.0520
| R1 | R2 | R3 | |
| RESISTANCE | 1.0575 | 1.0610 | 1.0650 |
| S1 | S2 | S3 | |
| SUPPORT | 1.0490 | 1.0455 | 1.0410 |
Sterling Pounds (GBPUSD)
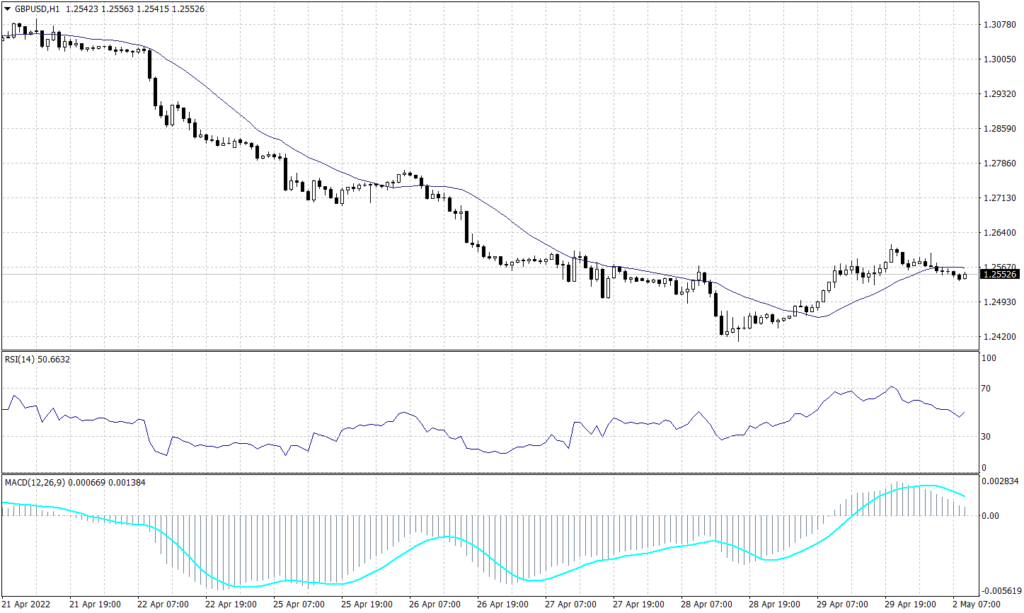
The Cable retains its downtrend under the pressure from the U.S. Dollar, the sterling pound will be under heavier pressure later this week as traders wait for the BoE statement. However, it is expected for the sterling pound to reach the low of 1.2300 before bulls reclaim the lead or slow down the fall.
The RSI and MACD are showing signals for a further decline in a slow fashion, while price action retains the reading of a low of 1.2300.
PIVOT POINT: 1.2500
| R1 | R2 | R3 | |
| RESISTANCE | 1.2565 | 1.2635 | 1.2690 |
| S1 | S2 | S3 | |
| SUPPORT | 1.2440 | 1.2360 | 1.2300 |
Japanese Yen (USDJPY)
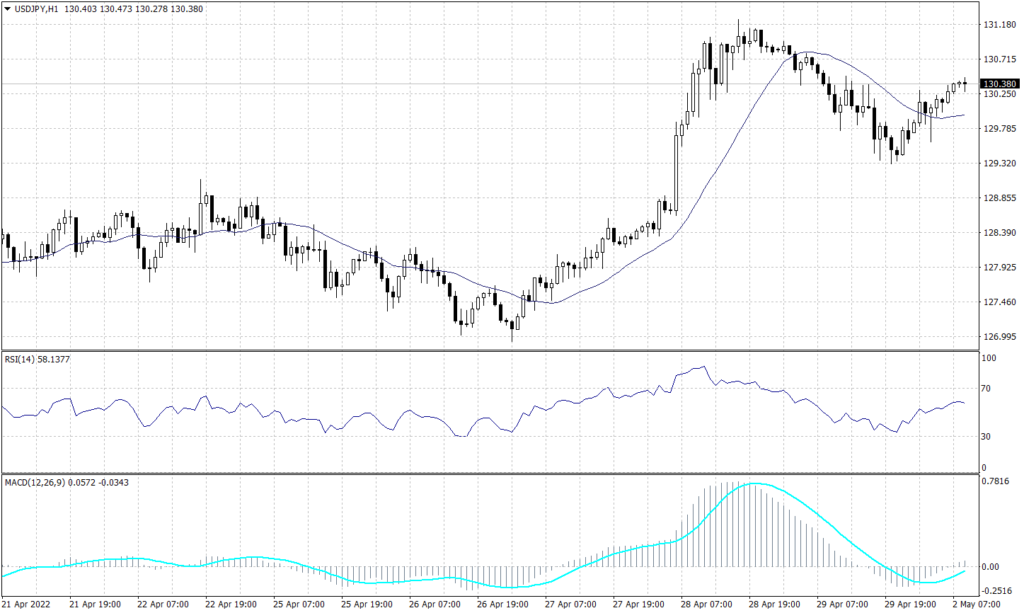
The USDJPY remains on an uptrend on the daily chart, after reaching a 20-year high above 131.20 last week. The pair is moving in a bullish trend on the hourly chart, as it is retesting the resistance level of 130.35 following an initial impulsive rise to the upside. Technical indicators imply that prices will continue towards 133.10.
PIVOT POINT: 130.35
| R1 | R2 | R3 | |
| RESISTANCE | 131.20 | 132.10 | 133.10 |
| S1 | S2 | S3 | |
| SUPPORT | 129.70 | 129.10 | 128.60 |
Spot Gold (XAUUSD)
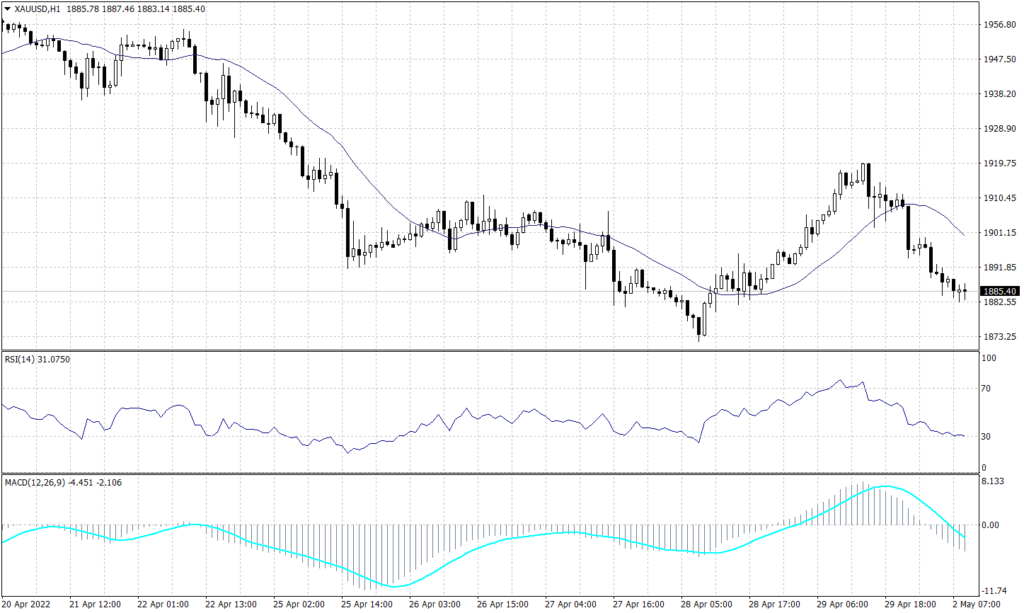
The precious metal shall be trading under heavy pressure this week as investors await the FOMC meeting and the Fed statement. The previous signals remain the same, as there will be no sign of an uptrend unless prices broke above the emotional support of 1,920. On a daily time, frame, the general trend for the Gold remains negative, as the price is currently near below 1,900 testing the support above 1,880.
The hourly chart shows a continuation of the bearish trend line if it broke below the hourly support of 1,885. Furthermore, both the RSI and the MACD imply that the bearish trend will continue.
PIVOT POINT: 1,885
| R1 | R2 | R3 | |
| RESISTANCE | 1,910 | 1,917 | 1,920 |
| S1 | S2 | S3 | |
| SUPPORT | 1,880 | 1,875 | 1,873 |
Crude Oil (USOUSD)
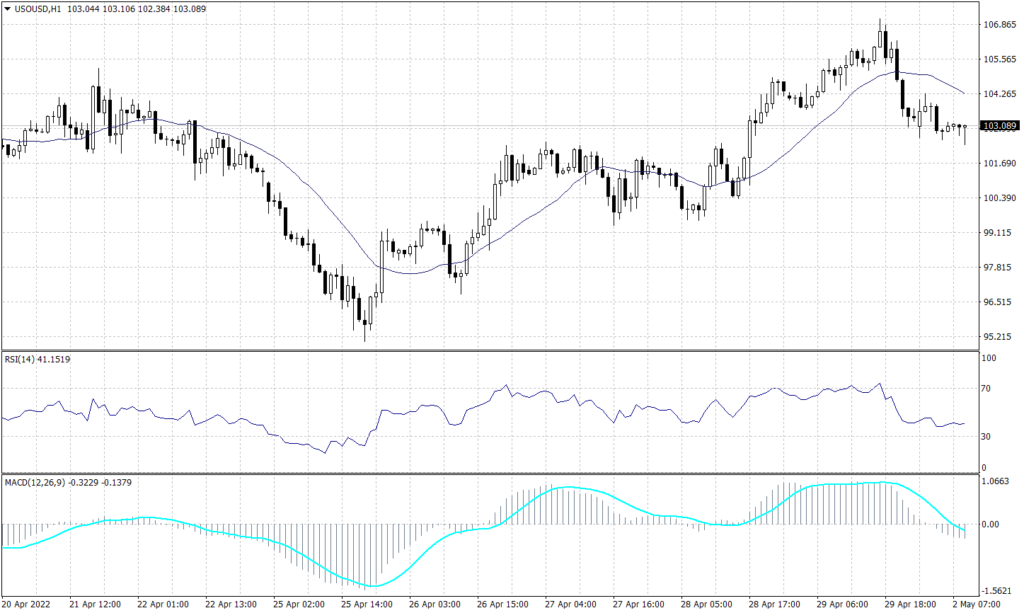
The U.S. Oil traded flat this morning as supply and demand uncertainty takes over the market. Similarly, the overall trend remains undecisive and the short-term short candles favour the negative trend.
PIVOT POINT: 103.10
| R1 | R2 | R3 | |
| RESISTANCE | 103.75 | 104.25 | 105.00 |
| S1 | S2 | S3 | |
| SUPPORT | 102.85 | 101.55 | 100.40 |
Bitcoin (BTCUSD)
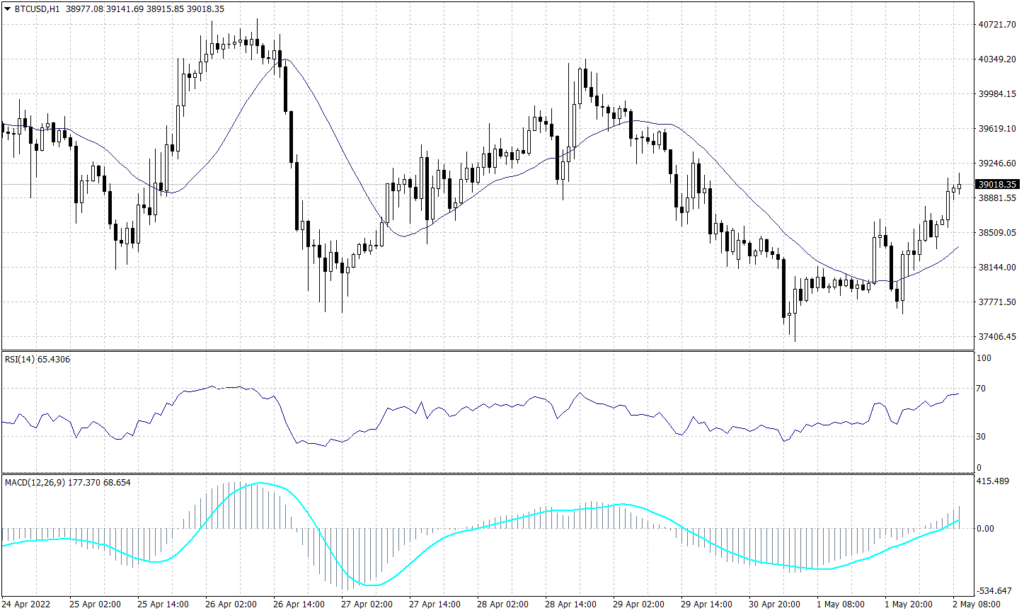
The crypto flagship finally showed some bullish movements due to the higher buying volumes before, as Bitcoin is seen as a safe-haven alternative. The leading cryptocurrency is trading just at the resistance level of 39,000 and diverging from the 20 period moving average.
However, the Bitcoin trend on the daily chart remains bearish and tends to continue unless the price breaks above 43,000, which is unlikely. Furthermore, both the RSI and MACD indicators show a likelihood of further decline towards 38,500 during the day.
PIVOTPOINT: 39,000
| R1 | R2 | R3 | |
| RESISTANCE | 39,250 | 39,500 | 40,100 |
| S1 | S2 | S3 | |
| SUPPORT | 38,500 | 38,145 | 37,770 |
Tags
Open Live Account
Please enter a valid country
No results found
No results found
Please enter a valid email
Please enter a valid verification code
1. 8-16 characters + numbers (0-9) 2. blend of letters (A-Z, a-z) 3. special characters (e.g, !a#S%^&)
Please enter the correct format
Please tick the checkbox to proceed
Please tick the checkbox to proceed
Important Notice
STARTRADER does not accept any applications from Australian residents.
To comply with regulatory requirements, clicking the button will redirect you to the STARTRADER website operated by STARTRADER PRIME GLOBAL PTY LTD (ABN 65 156 005 668), an authorized Australian Financial Services Licence holder (AFSL no. 421210) regulated by the Australian Securities and Investments Commission.
CONTINUEImportant Notice for Residents of the United Arab Emirates
In alignment with local regulatory requirements, individuals residing in the United Arab Emirates are requested to proceed via our dedicated regional platform at startrader.ae, which is operated by STARTRADER Global Financial Consultation & Financial Analysis L.L.C.. This entity is licensed by the UAE Capital Market Authority (CMA) under License No. 20200000241, and is authorised to introduce financial services and promote financial products in the UAE.
Please click the "Continue" button below to be redirected.
CONTINUEError! Please try again.

