


market news summary
U.S. Dollar Index (USDX)
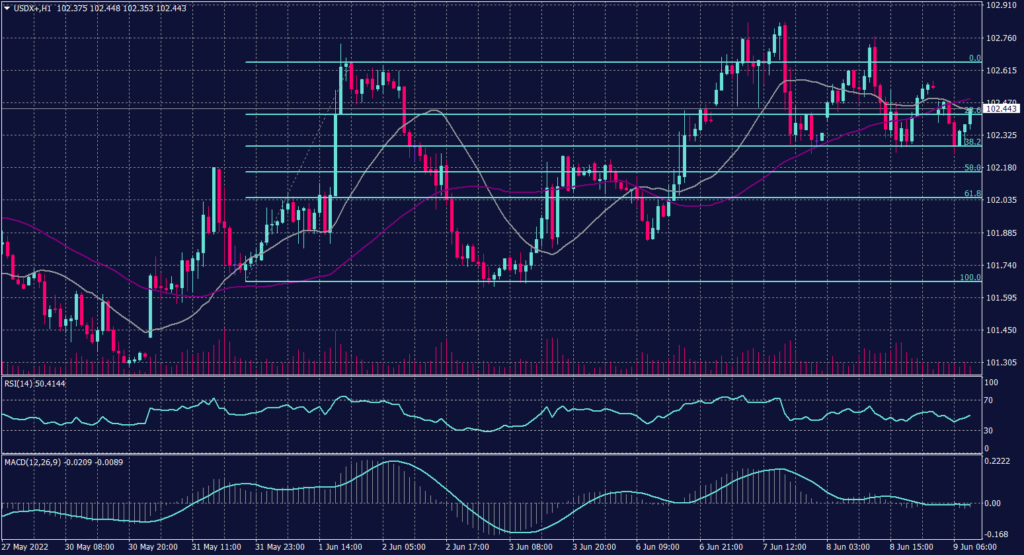
The U.S. Dollar was down this morning in Asia. The European Central Bank meeting and its policy are the focus of the market today. The U.S. Dollar Index inched down 0.09% to 102.45.
Technically:
The U.S. Dollar index formed a declining pattern as bears formed resistance at 102.60, but the USDX remains trading above 102.30 for the time being. Meanwhile, on the daily chart, the USDX is trying to break away from the declining trendline, but it remains bearish for the longer term.
On the hourly chart, 20 SMA and 55 SMA are moving below the current price levels pointing support formation.
PIVOT POINT: 102.40
| SUPPORT | RESISTANCE |
| 102.30 | 102.60 |
| 102.00 | 102.80 |
| 101.90 | 103.00 |
Euro (EURUSD)
The ECB seems not confident to pull an end to its long-running asset purchase program at the end of this month and promises a rate hike for July, but the size and pace of its tightening are uncertain. Speculation is growing that eurozone inflation could push the ECB into booting off its hike campaign with a 50 basis point rate increase.
Technically:
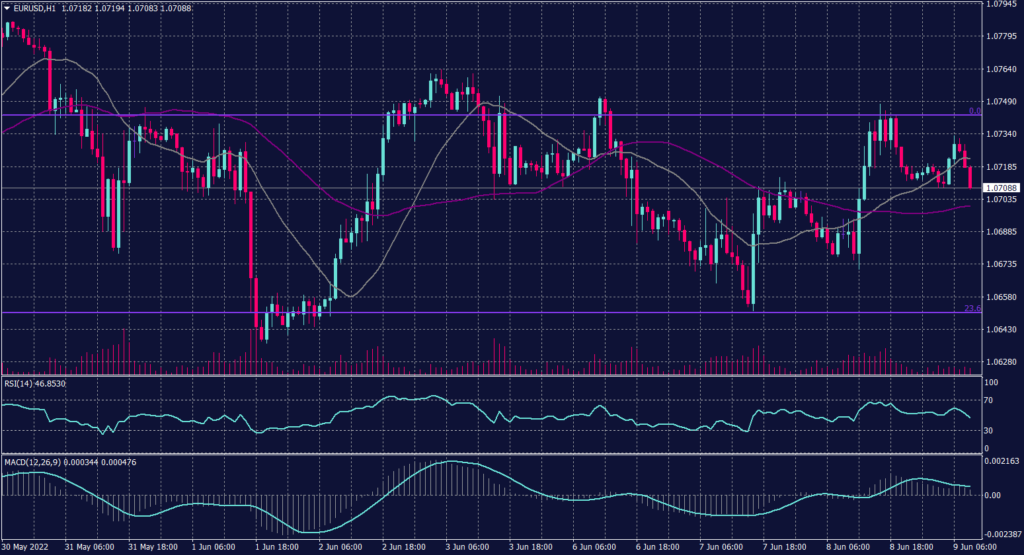
Bears remain in control over the overall trend of the currency while heading towards 1.0650.
Fibonacci retracement shows resistance1.0750 and fairly strong support at 1.0650, on the other hand, technical indicators show a possibility of a decline. Though, moving averages show a horizontal movement and set support at 1.0700.
PIVOT POINT: 1.0700
| SUPPORT | RESISTANCE |
| 1.0650 | 1.0720 |
| 1.0610 | 1.0780 |
| 1.0550 | 1.0840 |
Japanese Yen (USDJPY)
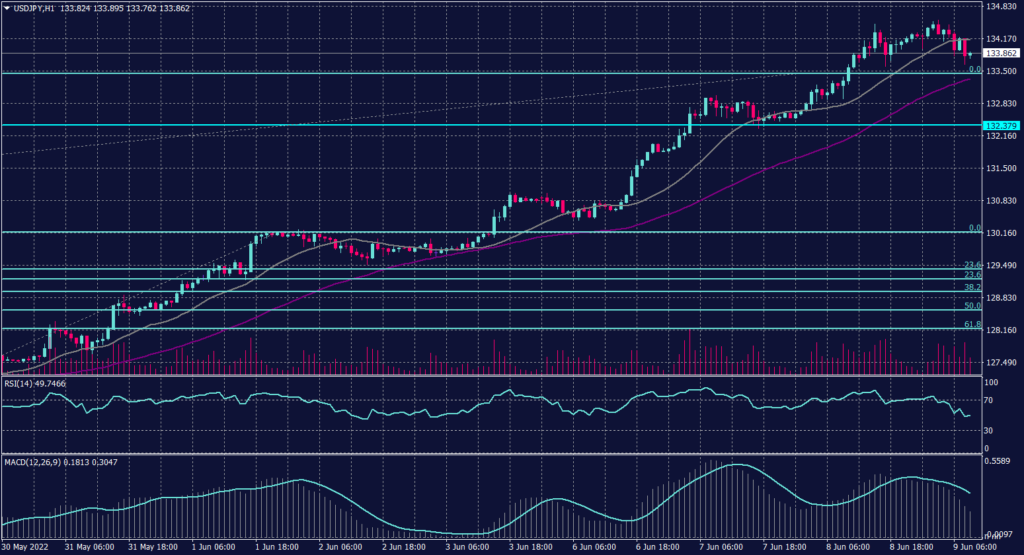
The yen extended its slide, falling to a fresh 20-year low of 134.56 against the greenback. It is trading close to 135.20 and if it weakened beyond that would be its lowest since October 1998. Rising interest rates around the world held the yen down, while the Bank of Japan remains stubborn in keeping policy stimulatory.
Technically:
On the daily chart, the USDJPY is a continuation of the current uptrend, while daily chart technical indicators show a slowdown. Though, Technical indicators on both the hourly and the daily charts are easing and signalling a change in the trend. that the pair is slowing the rise.
PIVOT POINT: 133.50
| SUPPORT | RESISTANCE |
| 132.00 | 134.20 |
| 130.00 | 134.50 |
| 127.00 | 135.20 |
Spot Gold (XAUUSD)
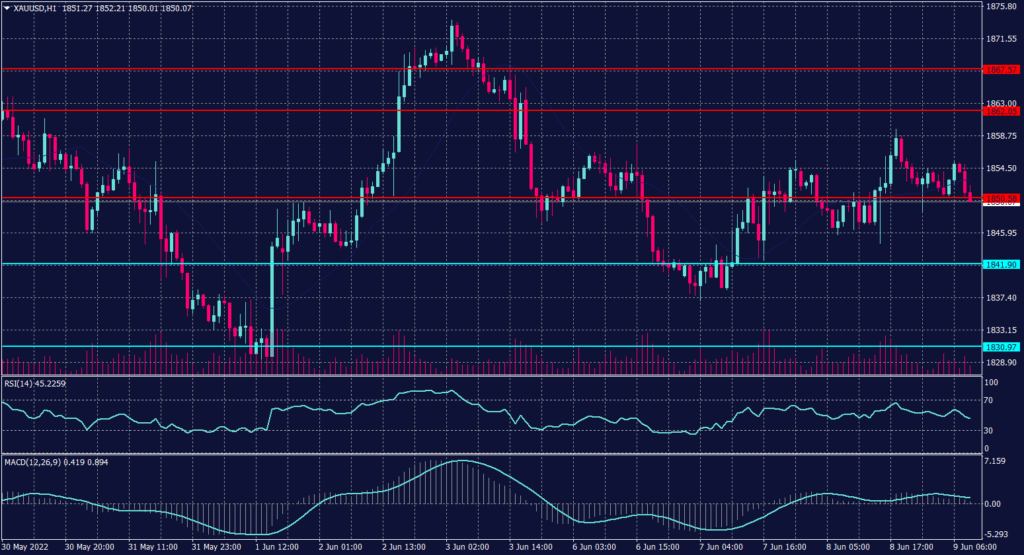
The yellow metal traded lower and formed a bearish pattern below 1,854 and showed a tendency to form a resistance below the previous support of 1,852. Gold prices are set for a decline towards 1,810 on the daily chart. Meanwhile, in the hourly chart, spot gold penetrated out of the regression channel, but it remains set to decline.
On the daily chart, the precious metal returns to its primary decline trend targeting the resistance at 1,810 and 1,790. However, spot gold shows a change in direction and signals further decline below the support at 1,842 during the day.
PIVOT POINT: 1,850
| SUPPORT | RESISTANCE |
| 1,842 | 1,866 |
| 1,837 | 1,872 |
| 1,830 | 1,875 |
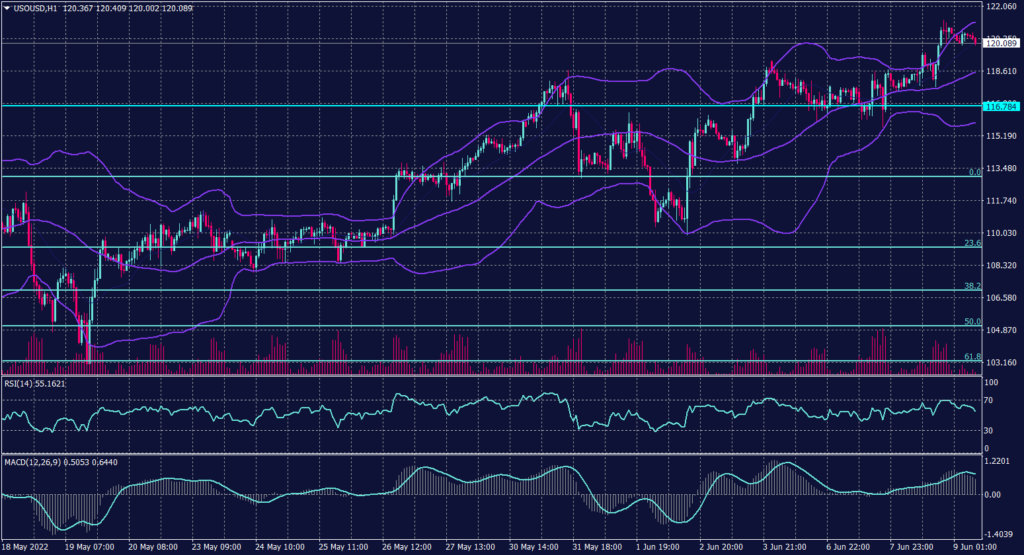
West Texas Crude (USOUSD)
Oil was up on Thursday morning in Asia as U.S. demand stays strong and China demand may rebound with COVID-19 curbs easing. Brent oil futures rose 0.26% to $123.90, while WTI futures edged up 0.18% to $122.33.
Wednesday’s U.S. crude supply data from the U.S. Energy Information Administration (EIA) showed a build of 2.025 million barrels. EIA data also indicated that gasoline stockpiles dropped by 812,000 barrels to 218.18 million barrels last week, implying fuel demand resilience despite soaring prices.
Technically:
As mentioned yesterday, WTI broke the resistance at $118 to trade above $122 before retreating towards $120 a barrel. WTI remains in the uptrend on the daily chart targeting $125 a barrel while forming support above $118.60 as per the 55 SMA readings.
However, today WTI is likely to swing to the same level as the 55 SMA at $118.60. Fibonacci retracement shows firm support at 115. RSI is showing WTI is oversold.
PIVOT POINT: 119.00
| SUPPORT | RESISTANCE |
| 115.00 | 120.00 |
| 109.50 | 122.00 |
| 108.30 | 123.00 |
Tags
Open Live Account
Please enter a valid country
No results found
No results found
Please enter a valid email
Please enter a valid verification code
1. 8-16 characters + numbers (0-9) 2. blend of letters (A-Z, a-z) 3. special characters (e.g, !a#S%^&)
Please enter the correct format
Please tick the checkbox to proceed
Please tick the checkbox to proceed
Important Notice
STARTRADER does not accept any applications from Australian residents.
To comply with regulatory requirements, clicking the button will redirect you to the STARTRADER website operated by STARTRADER PRIME GLOBAL PTY LTD (ABN 65 156 005 668), an authorized Australian Financial Services Licence holder (AFSL no. 421210) regulated by the Australian Securities and Investments Commission.
CONTINUEImportant Notice for Residents of the United Arab Emirates
In alignment with local regulatory requirements, individuals residing in the United Arab Emirates are requested to proceed via our dedicated regional platform at startrader.ae, which is operated by STARTRADER Global Financial Consultation & Financial Analysis L.L.C.. This entity is licensed by the UAE Capital Market Authority (CMA) under License No. 20200000241, and is authorised to introduce financial services and promote financial products in the UAE.
Please click the "Continue" button below to be redirected.
CONTINUEError! Please try again.

