


market news summary
GBP lower after BoE decision;
Crude Oil finds resistance at 107;
Gold is strongly bearish.
U.S. Dollar Index (USDX)
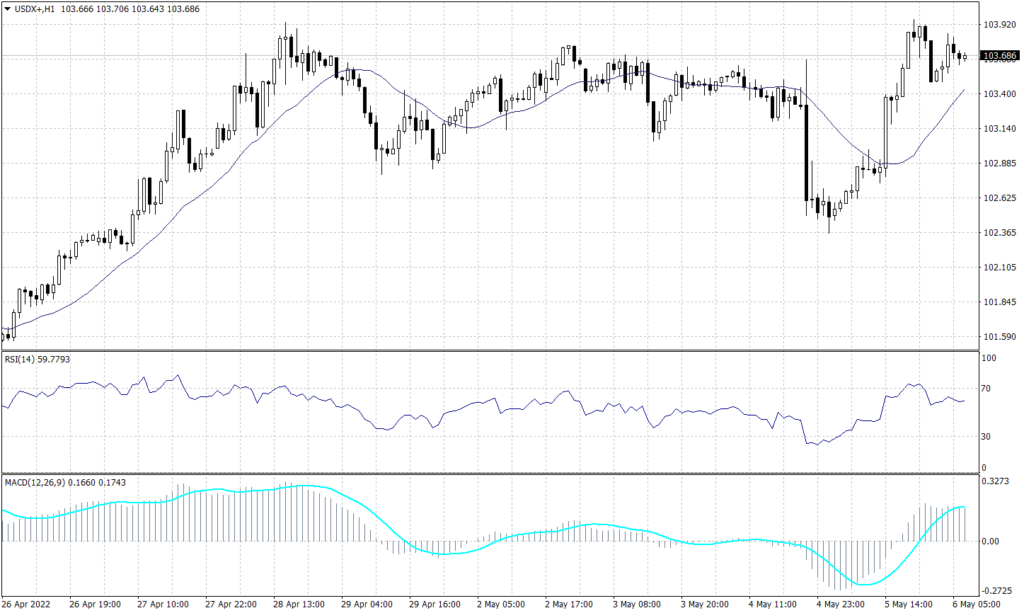
The U.S. Dollar index found a hard time breaking above 103.60 as the resistance intensified before the Non-Farm Payroll data.
Technically, after 7 days of trading below the resistance of 103.60, the index value remains expected to decline to 100.50. However, on the hourly chart, technical indicators and trend lines expect the index to hover around 103 during the day.
PIVOT POINT: 103.65
| R1 | R2 | R3 | |
| RESISTANCE | 103.00 | 103.30 | 103.60 |
| S1 | S2 | S3 | |
| SUPPORT | 103.40 | 102.90 | 102.55 |
Euro (EURUSD)
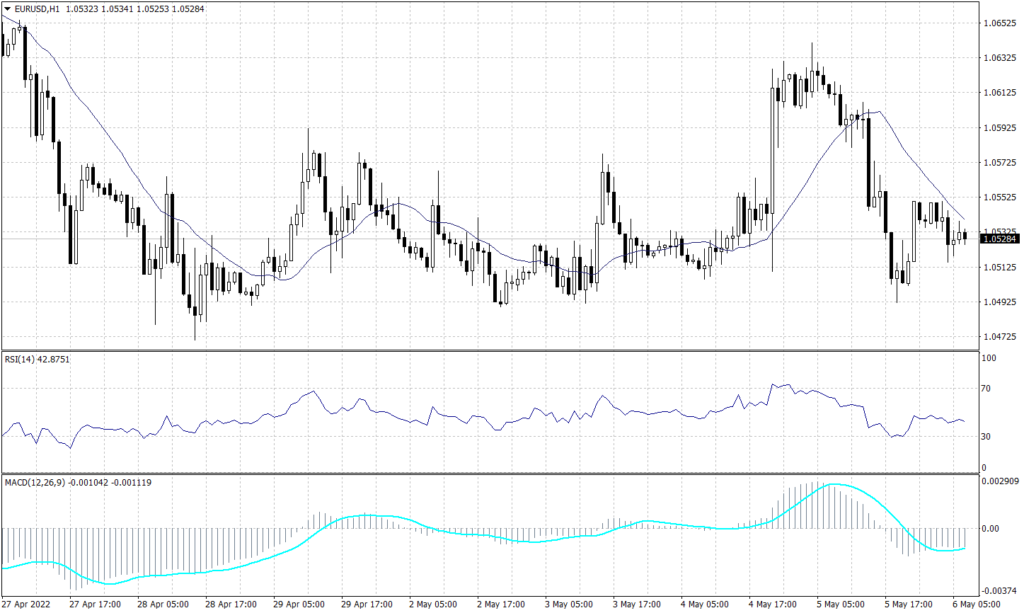
The common currency declined from its highest rate in a week at 1.0641 to trade around 1.0530. Though the pair is unlikely to retain an uptrend, it is expected to continue the downtrend during the day. Technical indicators signal a downturn towards 1.04925. Meanwhile, in the longer term, the pair is set to continue its primary downtrend.
PIVOT POINT: 1.0530
| R1 | R2 | R3 | |
| RESISTANCE | 1.0650 | 1.0675 | 1.0730 |
| S1 | S2 | S3 | |
| SUPPORT | 1.0455 | 1.0410 | 1.0350 |
Sterling Pounds (GBPUSD)
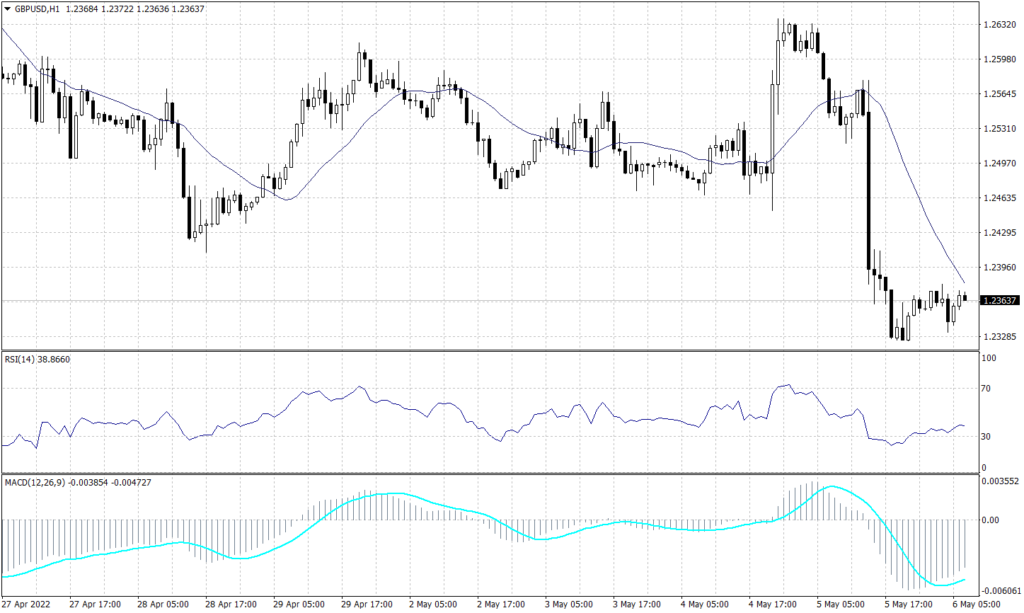
The sterling pound lost ground against the U.S. dollar after the announcement of a 25 basis points increase in the BoE interest rate. However, the cable has traded near the previously mentioned low of 1.2300 reaching the lowest since June 2020.
On the daily chart, the pair is expected to fall to 1.2090, while the hourly chart shows a likelihood to trade around 1.2300 during the day. The RSI and MACD are showing signals for a further decline in a slow fashion, while price action retains the reading around 1.2300 during the day.
PIVOT POINT: 1.2360
| R1 | R2 | R3 | |
| RESISTANCE | 1.2400 | 1.2565 | 1.2690 |
| S1 | S2 | S3 | |
| SUPPORT | 1.2300 | 1.2200 | 1.2090 |
Japanese Yen (USDJPY)
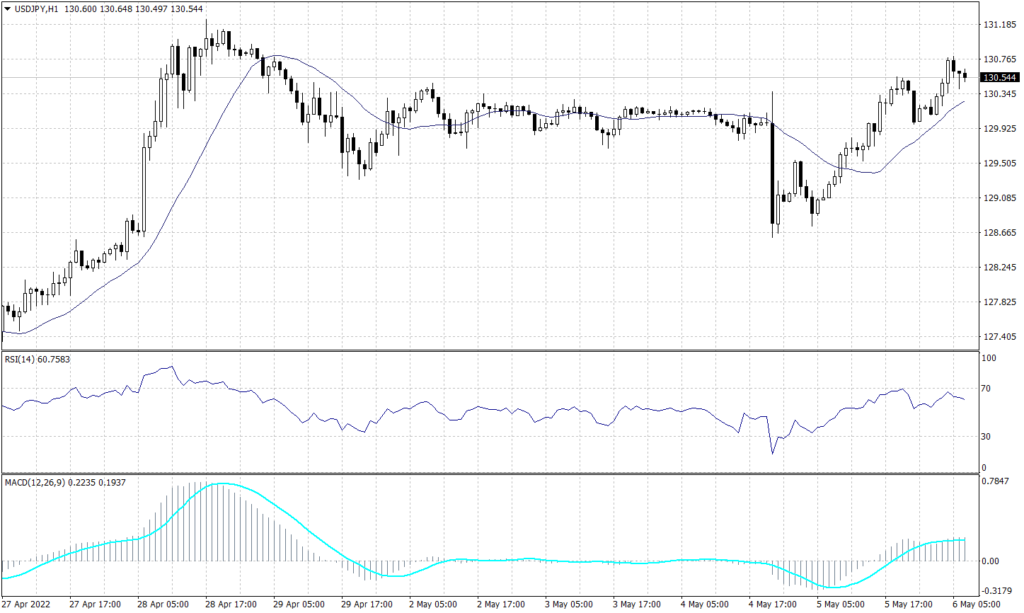
The Japanese yen was weaker against the greenback and traded above 130.50 during the early trades. The USDJPY pair closed above the resistance of 130 yesterday and traded higher after the opening of the Asian session.
The primary trend remains upwards targeting 132. The pair retains the bullish trend on the hourly chart despite yesterday’s fall and is supported above the broken resistance of 128. Technical indicators imply that prices are likely to hover between 128.60 and 130.70.
PIVOT POINT: 130.25
| R1 | R2 | R3 | |
| RESISTANCE | 130.70 | 131.20 | 132.00 |
| S1 | S2 | S3 | |
| SUPPORT | 128.60 | 128.35 | 127.90 |
Spot Gold (XAUUSD)
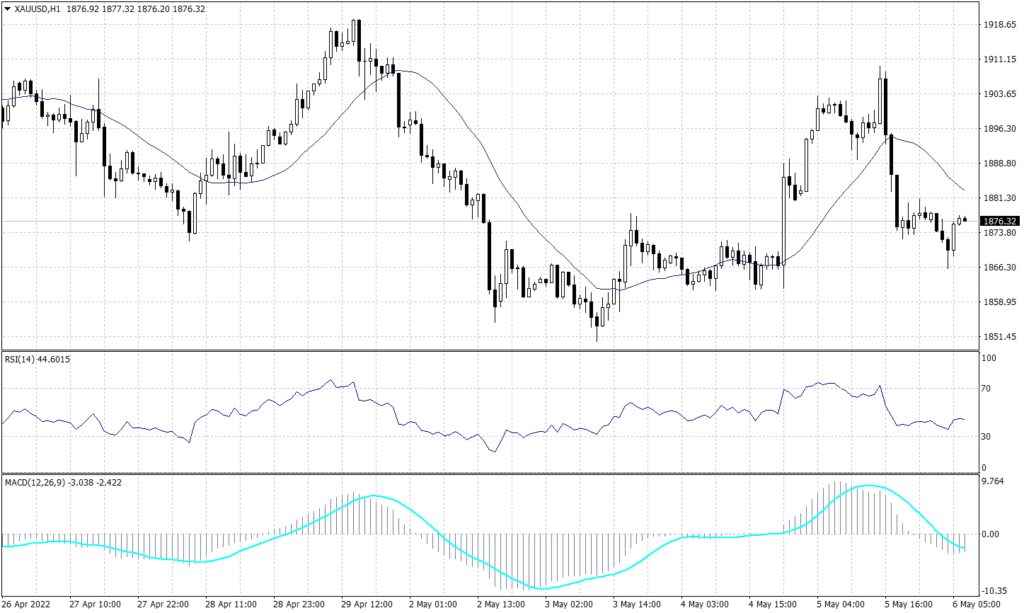
The precious metal traded at 1,875 during the early trades benefiting from the slight decrease in market sentiment. Gold prices retain their negative trend on the daily chart, but it is likely to continue the long-term downward trend.
The daily chart shows a continuation of the bearish trend line targeting the range between 1,825 to 1,800. Meanwhile, the hourly chart shows gold in a light volume area, which indicates a turn to 1,880. Furthermore, both the RSI and the MACD imply that the bearish trend will continue.
PIVOT POINT: 1,875
| R1 | R2 | R3 | |
| RESISTANCE | 1,890 | 1,895 | 1,905 |
| S1 | S2 | S3 | |
| SUPPORT | 1,865 | 1,855 | 1,825 |
WTI (USOUSD)
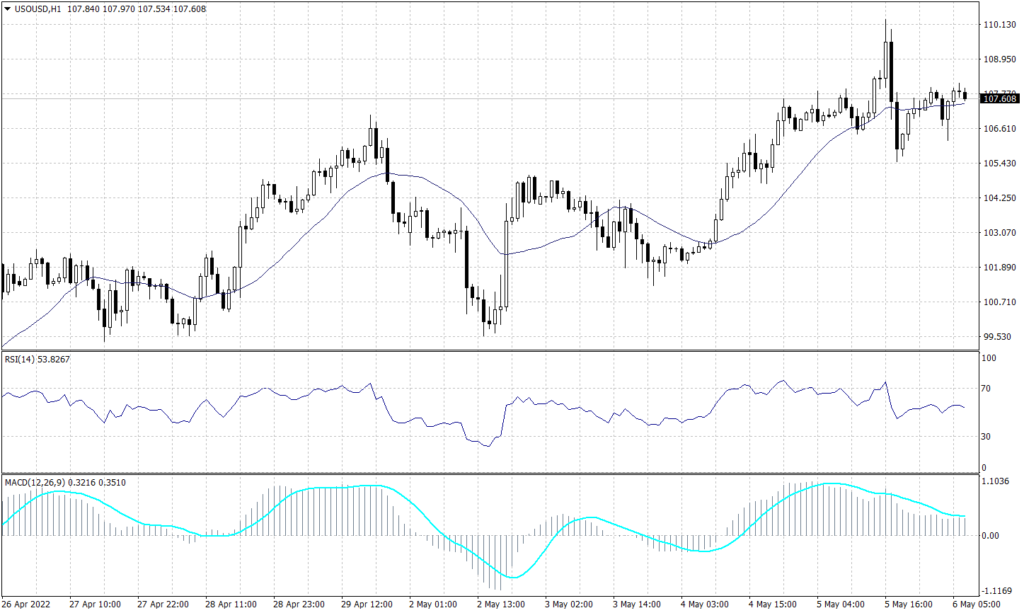
West Texas Intermediate crude traded with high volumes below 107.60 but remained under the pressure of the lower sentiment in the market to find resistance around 107.60. However, WTI price action indicates a further advance to $110 on the hourly chart and signals support above $106.40.
Still, MACD and RSI are opposing the chart readings and show a high possibility to drop towards $105.25 a barrel during the day and target $100 in the longer run.
PIVOT POINT: 107.00
| R1 | R2 | R3 | |
| RESISTANCE | 108.40 | 110.00 | 111.20 |
| S1 | S2 | S3 | |
| SUPPORT | 106.00 | 105.25 | 104.00 |
Tags
Open Live Account
Please enter a valid country
No results found
No results found
Please enter a valid email
Please enter a valid verification code
1. 8-16 characters + numbers (0-9) 2. blend of letters (A-Z, a-z) 3. special characters (e.g, !a#S%^&)
Please enter the correct format
Please tick the checkbox to proceed
Please tick the checkbox to proceed
Important Notice
STARTRADER does not accept any applications from Australian residents.
To comply with regulatory requirements, clicking the button will redirect you to the STARTRADER website operated by STARTRADER PRIME GLOBAL PTY LTD (ABN 65 156 005 668), an authorized Australian Financial Services Licence holder (AFSL no. 421210) regulated by the Australian Securities and Investments Commission.
CONTINUEImportant Notice for Residents of the United Arab Emirates
In alignment with local regulatory requirements, individuals residing in the United Arab Emirates are requested to proceed via our dedicated regional platform at startrader.ae, which is operated by STARTRADER Global Financial Consultation & Financial Analysis L.L.C.. This entity is licensed by the UAE Capital Market Authority (CMA) under License No. 20200000241, and is authorised to introduce financial services and promote financial products in the UAE.
Please click the "Continue" button below to be redirected.
CONTINUEError! Please try again.

