


market news summary
U.S. Dollar Index (USDX)
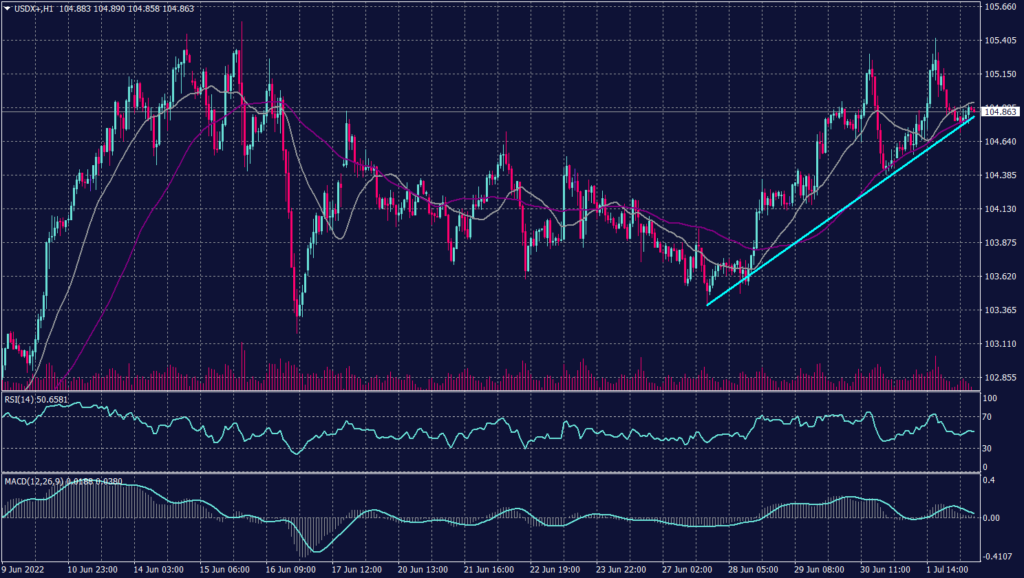
The dollar kept trade-sensitive currencies pinned near multi-year lows on Monday and the euro was under pressure as investors sought safety due to worries about slowing global growth.
The U.S. dollar index stood at 105.100, not far below last month’s two-decade high of 105.790. The Atlanta Federal Reserve’s much-watched GDP Now forecast has slid to an annualized -2.1% for the second quarter, implying the country was already in a technical recession.
Technically:
The daily chart indicates a continuation of the uptrend in the long term towards a new all-time high. Technical indicators can’t confirm the continuation while moving averages show horizontal signals. The hourly chart shows an upward movement but keeps the tendency for a slight decline on the way.
PIVOT POINT: 104.60
| SUPPORT | RESISTANCE |
| 104.40 | 105.00 |
| 104.00 | 105.30 |
| 103.60 | 105.40 |
Euro (EURUSD)
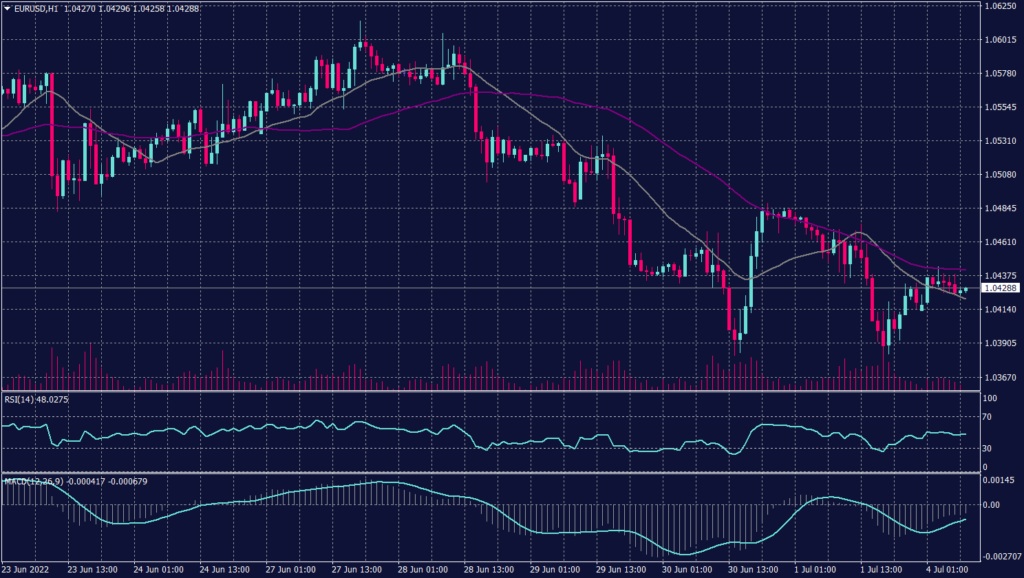
Data showed euro zone inflation surging to another record, adding to the case for the European Central Bank to hike interest rates this month.
While the common currency was steady at $1.0435 on Monday, it is barely above May’s five-year trough of $1.0349 and highlights the market’s preference for dollars as gloom clouds the outlook.
Technically:
The Euro pair remains to drown overall despite the support above 1.0400 and 1.0420. Meanwhile, on the hourly chart, the EURUSD traded upwards this morning bouncing from two weeks low. The pair show shows for decline continuation towards 1.0375 and technical indicators confirm the signal.
PIVOT POINT: 1.0420
| SUPPORT | RESISTANCE |
| 1.0375 | 1.0480 |
| 1.0320 | 1.0510 |
| 1.0280 | 1.0530 |
Australian Dollar (AUDUSD)
Australia’s central bank meets on Tuesday and investors are also awaiting the publication of minutes from last month’s Federal Reserve meeting on Wednesday, and U.S. employment data on Friday.
Markets have priced in a 40 basis point (bp) hike in Australia, so the Aussie may not catch much of a boost if that is delivered.
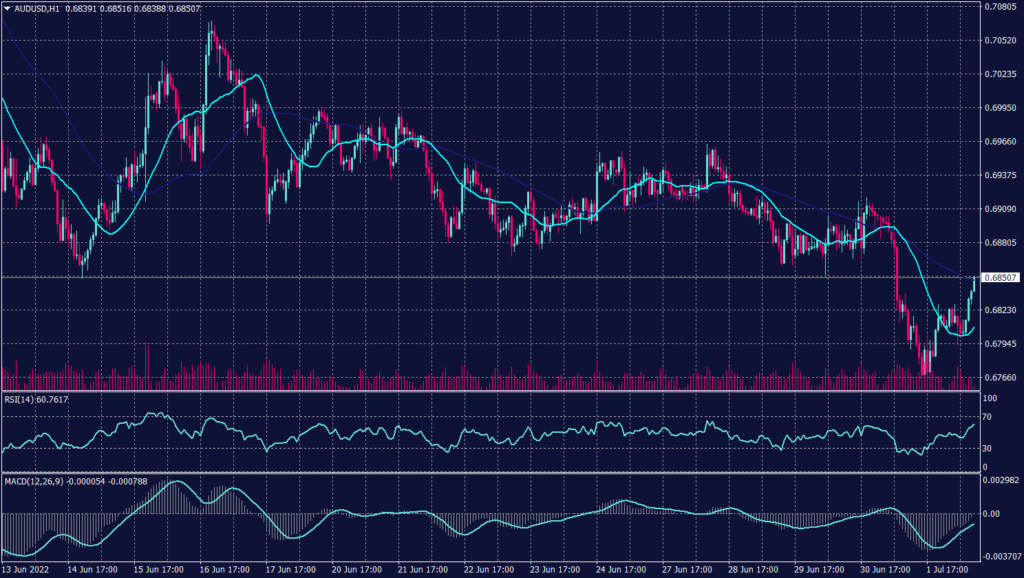
The Australian dollar hit two-year lows on Friday at 0.6764, while the Aussie traded down 0.3% to $0.6796 this morning.
Technically:
The Aussie remains within the primary downtrend towards 0.6700 on the daily chart while the hourly chart shows some fluctuations. The 55-periods moving average signals resistance at the current levels around 0.6860 on the hourly chart. Meanwhile, the 20-preiods moving average show a fluctuation and a possibility of a decline.
Technical indicators signal a possibility of a short continuation of the corrective movement before the down swing on the hourly chart.
PIVOT POINT: 0.6820
| SUPPORT | RESISTANCE |
| 0.6810 | 0.6870 |
| 0.6775 | 0.6900 |
| 0.6700 | 0.6960 |
Spot Gold (XAUUSD)
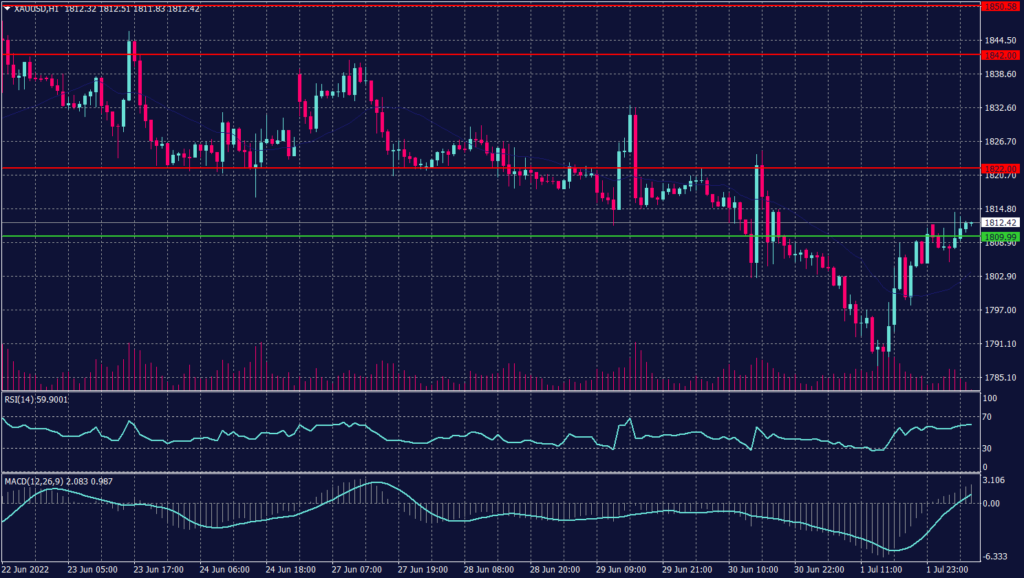
Gold inched higher as weakness in Treasury yields kept prices above the $1,800 mark. Spot gold was up 0.1% at $1,811.99 per ounce while gold futures rose 0.6% to $1,812.10. Bullion prices hit a five-month low of $1,783.50 on Friday. Benchmark U.S. 10-year Treasury yields fell to their lowest level in a month on Friday, buoying non-yielding bullion.
Technically:
Gold broke below the support at $1,800 which confirms a drop towards $1,785. The daily chart, however, show a continuation of the negative trend towards $1,750 unless the prices pounced to 1,840, which is technically not as easy as the decline.
PIVOT POINT: 1,810
| SUPPORT | RESISTANCE |
| 1,800 | 1,820 |
| 1,785 | 1,814 |
| 1,750 | 1,842 |
West Texas Crude (USOUSD)
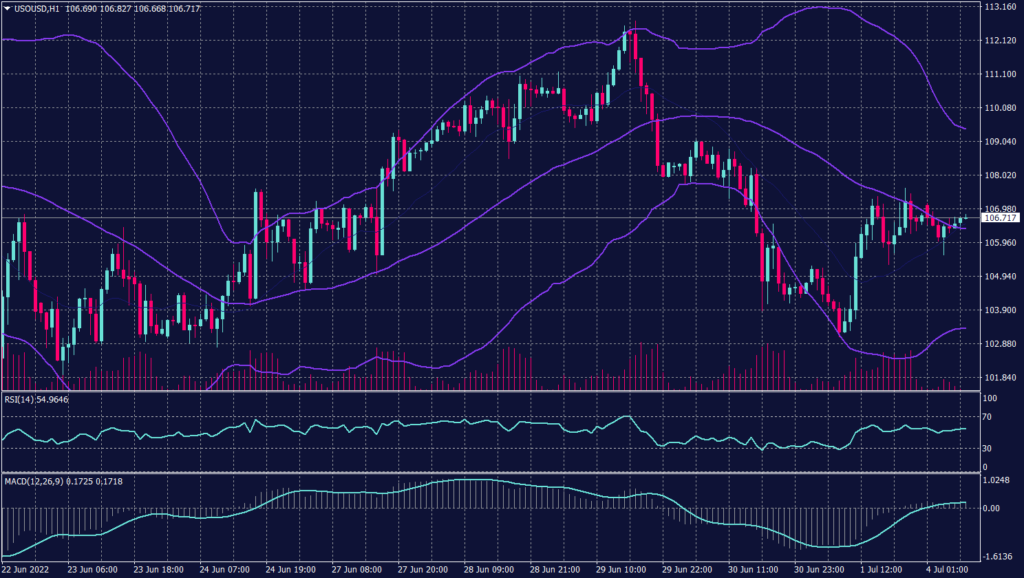
Oil prices fell on Monday, paring gains from the previous session, as fears of a global recession weighed on the market even as supply remains tight amid lower OPEC output, unrest in Libya, and sanctions on Russia.
Brent crude futures for September slipped 0.3% to $111.27 a barrel.
Meanwhile, WTI crude futures for August delivery dropped 0.3% to $108.09 a barrel.
Oil supply concerns remain, preventing steeper price falls. Output from the 10 members of OPEC in June fell 100,000 barrels per day (bpd) to 28.52 million bpd, off their pledged increase of about 275,000 bpd, a Reuters survey showed.
Technically:
On the hourly chart, WTI prices show a decrease in volume traded due to the worries about the global growth and consumption. However, the daily chart confirms the high probability of the decline and targets $98 a barrel before any serious gains happen.
PIVOT POINT: 106.50
| SUPPORT | RESISTANCE |
| 103.40 | 108.30 |
| 102.20 | 109.50 |
| 100.00 | 111.00 |
Tags
Open Live Account
Please enter a valid country
No results found
No results found
Please enter a valid email
Please enter a valid verification code
1. 8-16 characters + numbers (0-9) 2. blend of letters (A-Z, a-z) 3. special characters (e.g, !a#S%^&)
Please enter the correct format
Please tick the checkbox to proceed
Please tick the checkbox to proceed
Important Notice
STARTRADER does not accept any applications from Australian residents.
To comply with regulatory requirements, clicking the button will redirect you to the STARTRADER website operated by STARTRADER PRIME GLOBAL PTY LTD (ABN 65 156 005 668), an authorized Australian Financial Services Licence holder (AFSL no. 421210) regulated by the Australian Securities and Investments Commission.
CONTINUEImportant Notice for Residents of the United Arab Emirates
In alignment with local regulatory requirements, individuals residing in the United Arab Emirates are requested to proceed via our dedicated regional platform at startrader.ae, which is operated by STARTRADER Global Financial Consultation & Financial Analysis L.L.C.. This entity is licensed by the UAE Capital Market Authority (CMA) under License No. 20200000241, and is authorised to introduce financial services and promote financial products in the UAE.
Please click the "Continue" button below to be redirected.
CONTINUEError! Please try again.

