


Gold Technical Analysis
Gold has experienced a significant bullish recovery after finding support near the $4,023 area. Since that low was established, the precious metal has produced a strong series of higher highs and higher lows, indicating that buyers have regained short-term control of the market.
The moving averages have shifted into a bullish configuration. Price remains above the 20-period moving average, while the 5-period and 10-period moving averages are still positioned above the longer-term average. This confirms that the broader recovery remains intact despite the minor pullback visible in the latest candles.
The next major resistance is located around $4,335–$4,360. A breakout above this region would likely attract additional buying interest and could trigger another leg higher. On the downside, support is found near $4,290, followed by the 20-period moving average around $4,260. A break below $4,260 would weaken the bullish outlook and suggest a deeper correction.
Buyers remain in control while gold trades above the rising 20-period moving average and above the $4,260 support region.
Gold 1H Chart
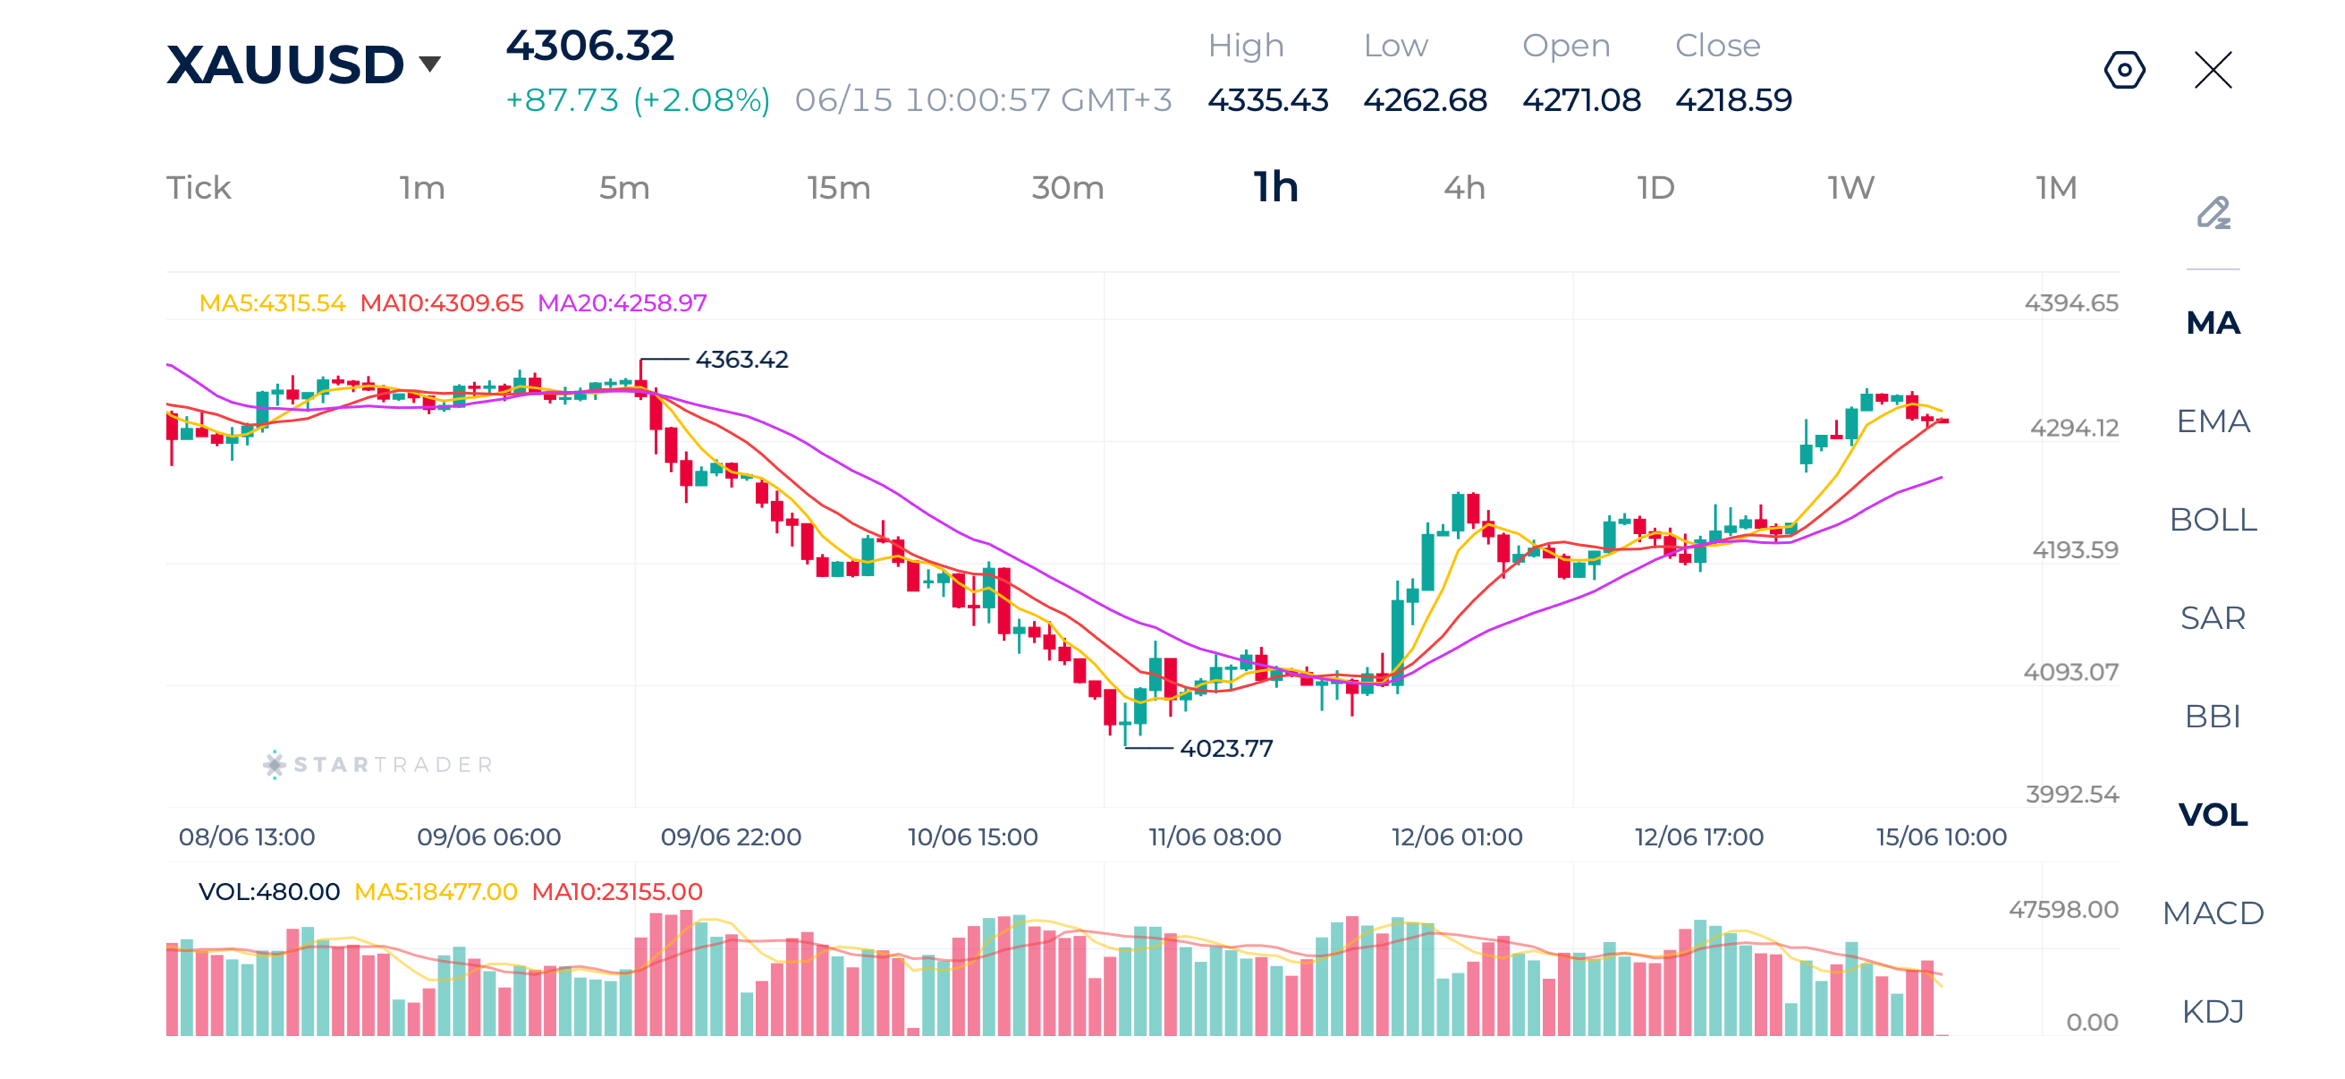
Source: STARTRADER app | Gold jumps back above $4,300 on a weaker dollar
| Resistance | $4,360 | $4,400 | $4,454 |
| Support | $4,290 | $4,260 | $4,200 |
Brent Technical Analysis
Brent crude remains under intense bearish pressure. The market continues to print lower highs and lower lows, and sellers have maintained control despite several attempts at stabilization.
The moving average structure remains strongly bearish. Price is trading below the 5, 10, and 20-period moving averages, while the 20-period MA continues to slope downward.
The area around $83.90–$84.00 is currently acting as immediate support. If sellers manage to break below this zone, the next downside targets would likely be $83.00 and potentially $82.00. On the upside, resistance is located around $85.70, followed by the 20-period moving average near $86.60–$87.00.
price would need to reclaim the 20-period moving average and establish itself above $87.00 before any meaningful recovery scenario becomes likely.
Brent 1H Chart
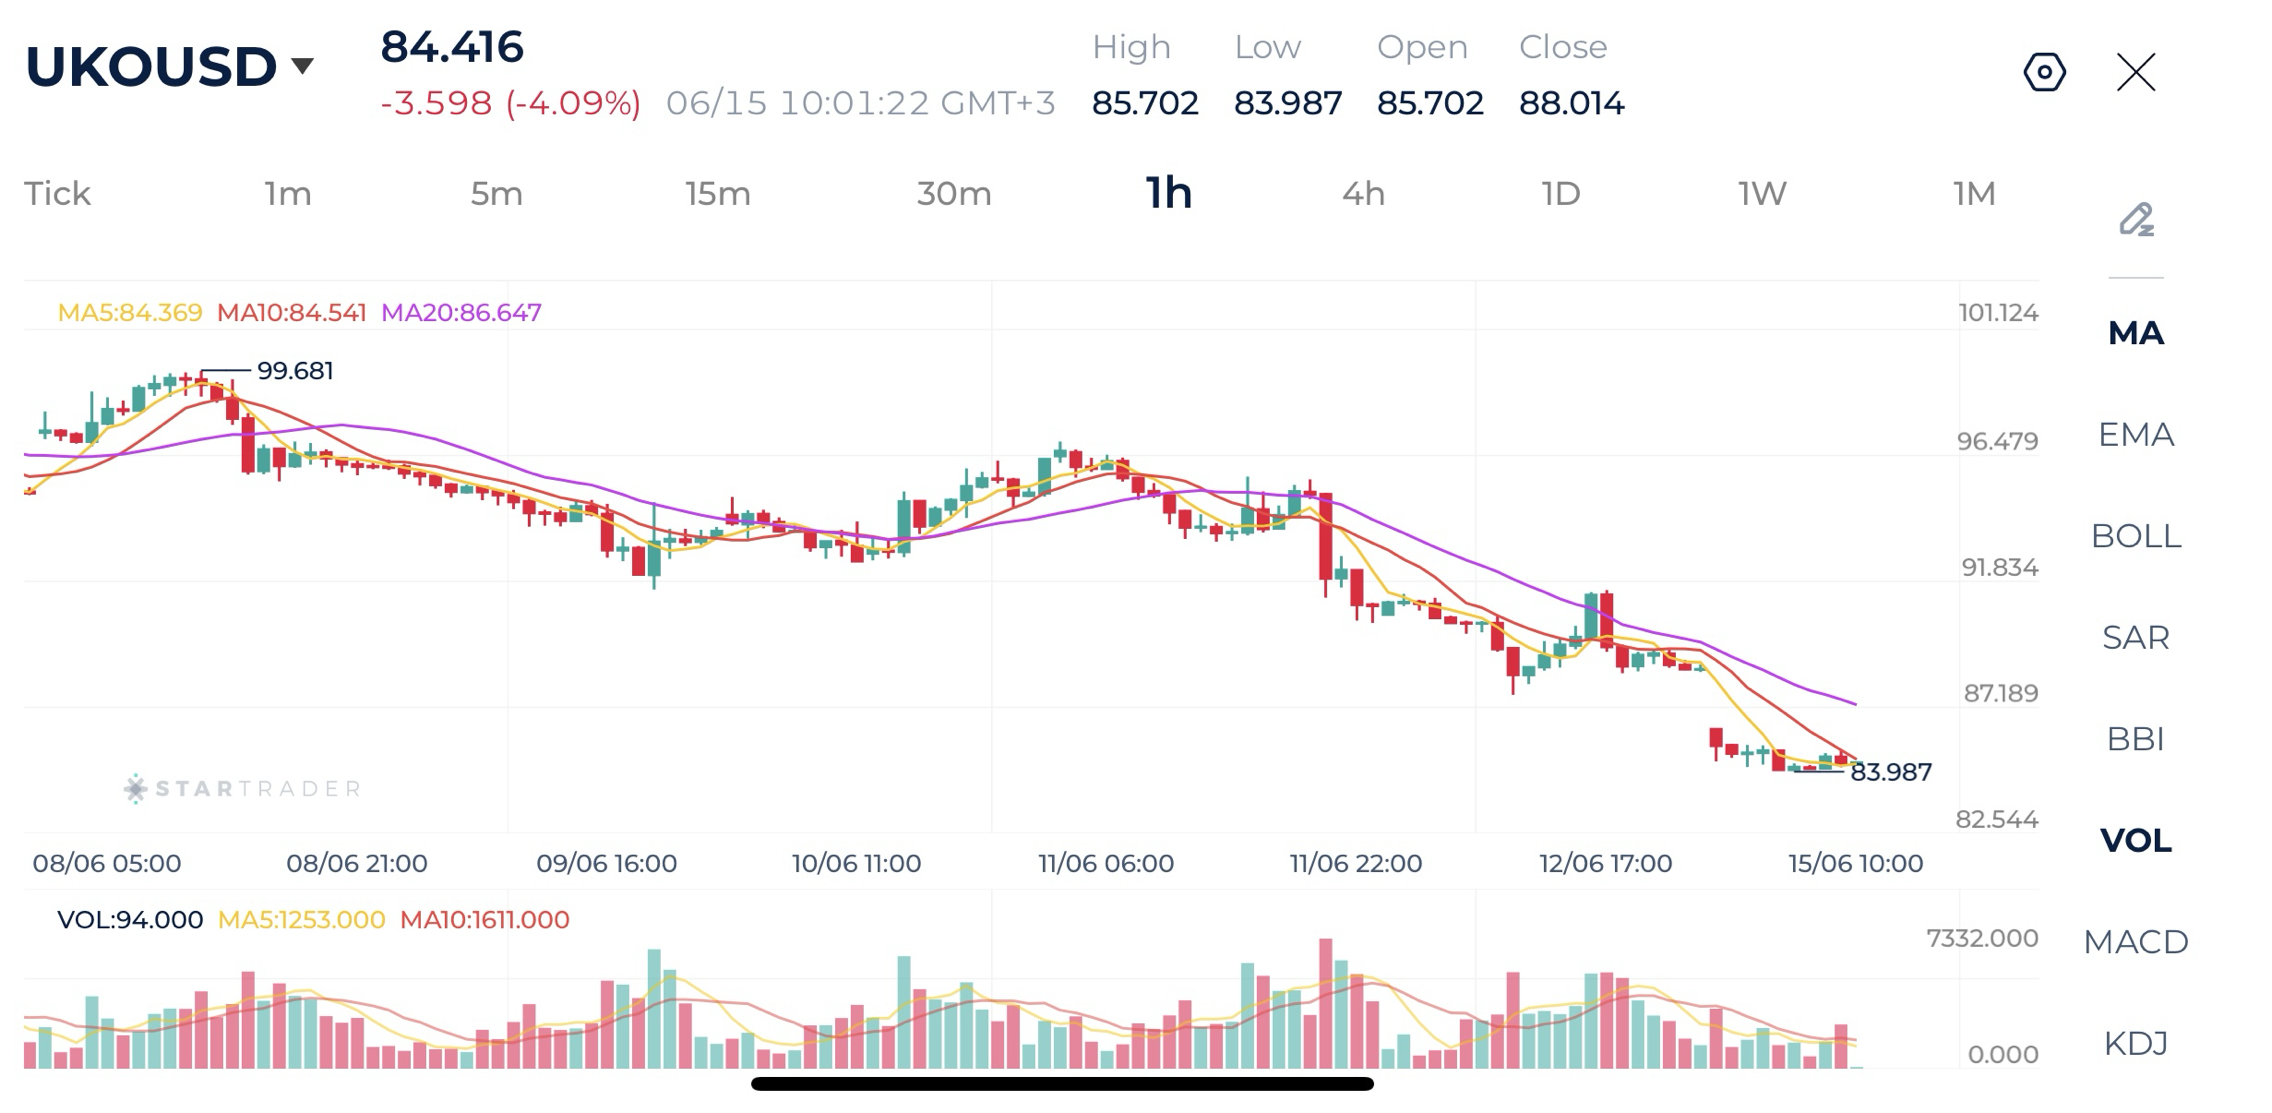
Source: STARTRADER app | Oil falls to its lowest level since early March
| Resistance | $85.70 | $86.85 | $87.90 |
| Support | $84.20 | $83.34 | $82.10 |
Nasdaq Technical Analysis
NASDAQ has staged an impressive recovery from the sharp selloff that pushed prices down to the 28,230 area earlier in the week.
The moving averages are aligned in a bullish configuration, with the 5-period MA above the 10-period MA and both above the 20-period MA. This structure reflects strong upside momentum. The recent breakout above the 30,000 psychological level is particularly important, as it suggests that market participants are once again targeting the highs seen before the correction.
However, the market is now approaching an important resistance area around 30,290–30,500. A pullback toward the 30,000–29,900 zone would be healthy and could provide a platform for another push higher.
As long as the index remains above 29,900 and especially above the 20-period moving average near 29,900, the bullish outlook remains intact. A break above 30,290 could open the door toward 30,500 and potentially higher levels, while a sustained move below 29,870 would suggest that the current rally is losing strength.
Nasdaq 1H Chart
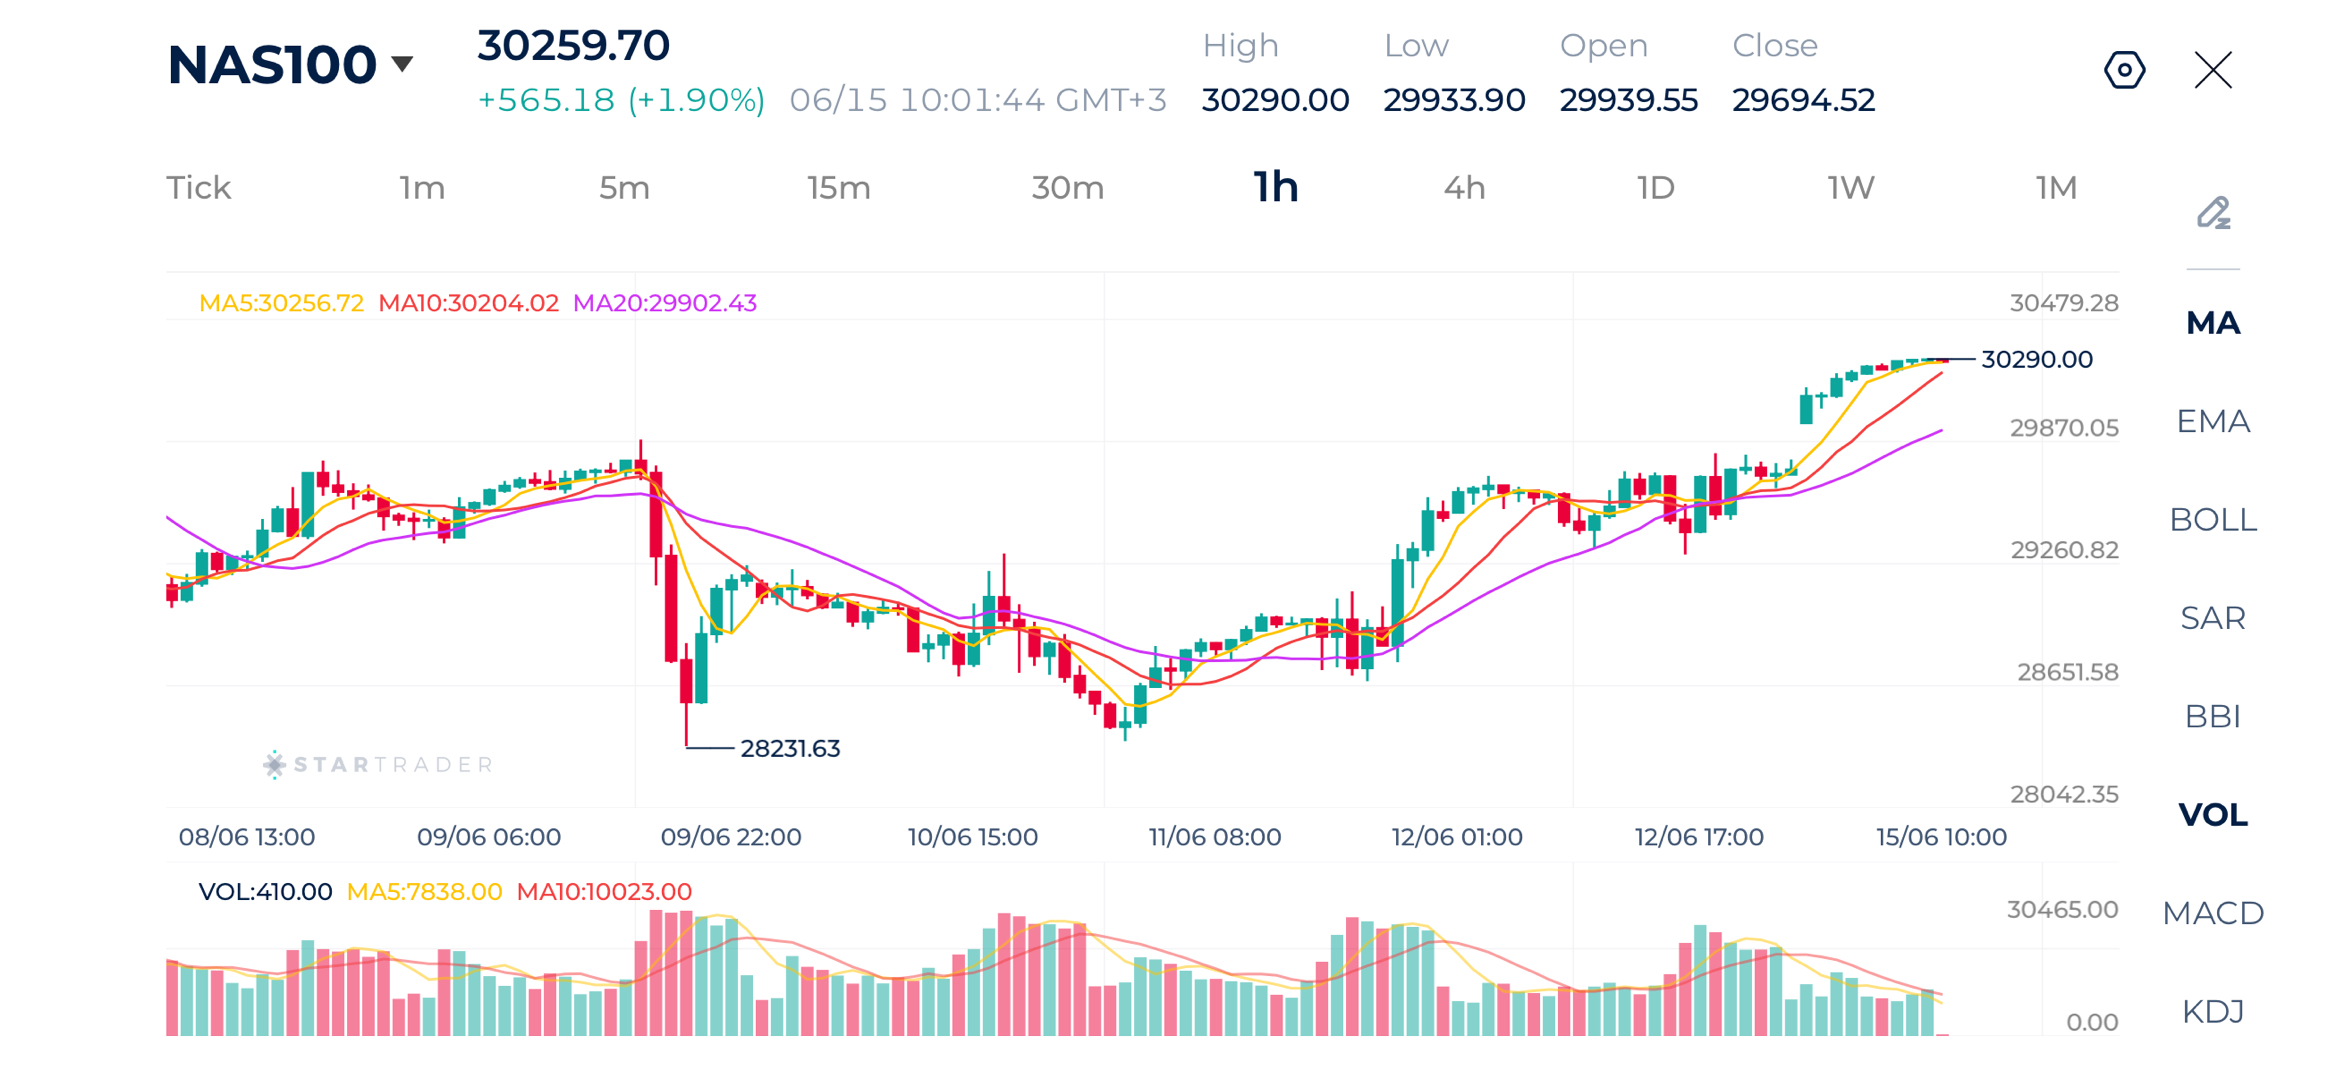
Source: STARTRADER app | Nasdaq opens higher, recovering the recent losses
| Resistance | 30,290 | 30,500 | 30,670 |
| Support | 29,870 | 29,654 | 29,458 |
Risk Disclaimer: This material is provided for informational purposes only and does not constitute a recommendation or investment advice. Trading financial instruments on margin involves substantial risk and may not be appropriate for all investors.
Tags
Open Live Account
Please enter a valid country
No results found
No results found
Please enter a valid email
Please enter a valid verification code
1. 8-16 characters + numbers (0-9) 2. blend of letters (A-Z, a-z) 3. special characters (e.g, !a#S%^&)
Please enter the correct format
Please tick the checkbox to proceed
Please tick the checkbox to proceed
Important Notice
STARTRADER does not accept any applications from Australian residents.
To comply with regulatory requirements, clicking the button will redirect you to the STARTRADER website operated by STARTRADER PRIME GLOBAL PTY LTD (ABN 65 156 005 668), an authorized Australian Financial Services Licence holder (AFSL no. 421210) regulated by the Australian Securities and Investments Commission.
CONTINUEImportant Notice for Residents of the United Arab Emirates
In alignment with local regulatory requirements, individuals residing in the United Arab Emirates are requested to proceed via our dedicated regional platform at startrader.ae, which is operated by STARTRADER Global Financial Consultation & Financial Analysis L.L.C.. This entity is licensed by the UAE Capital Market Authority (CMA) under License No. 20200000241, and is authorised to introduce financial services and promote financial products in the UAE.
Please click the "Continue" button below to be redirected.
CONTINUEError! Please try again.

