


U.S. Dollar Index (USDX)
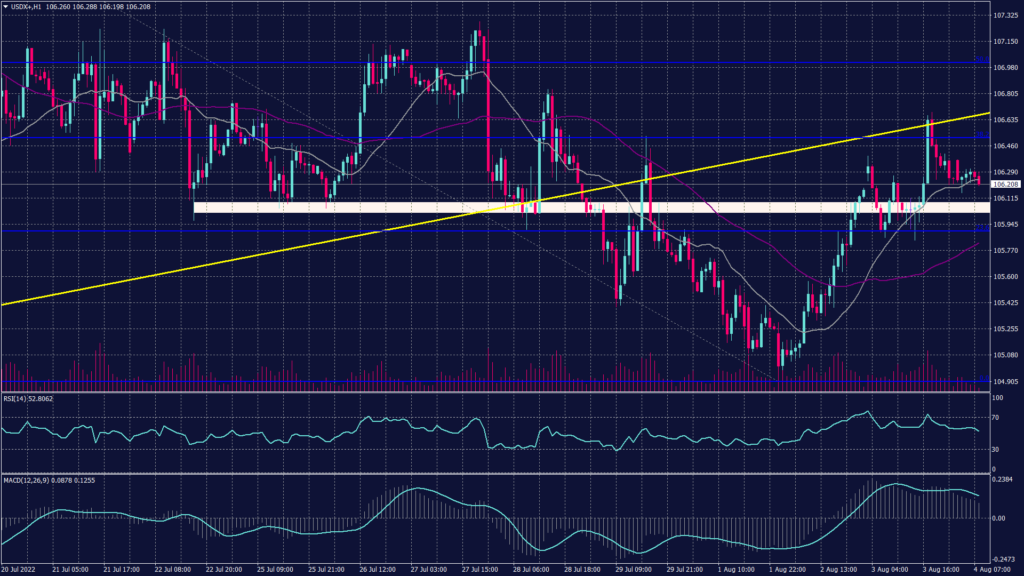
The dollar index surged nearly 1% in the past two days after hawkish comments from two Federal Reserve members drove up expectations of sharper interest rate hikes this year.
San Francisco Fed President Mary Daly and Chicago Fed President Charles Evans both signalled that inflation is yet to cool in the country, and the Fed was likely to raise rates even further to combat rising prices. A potential escalation in U.S.-China tensions had also driven safe haven demand for the greenback.
Technically:
The hourly chart remains negative for the time being as it is moving below the trend line since July 28 despite bulls tries to break back above that line. Meanwhile, the daily chart shows a high possibility of continuation towards the strong support at 103.55, which will raise two scenarios.
In the first scenario, if the index bounced from 103.55 it will most likely continue the main trend upwards. In the other scenario, if the index broke below the previous bottom at 103.55 it will be confirming the change of direction.
Technical indicators show mixed signals as RSI shows fluctuations between 104.60 and 105.40 while MACD shows a continuation to the downside.
PIVOT POINT: 106.10
| SUPPORT | RESISTANCE |
| 105.90 | 106.20 |
| 105.55 | 106.50 |
| 105.10 | 107.10 |
Japanese Yen (USDJPY)
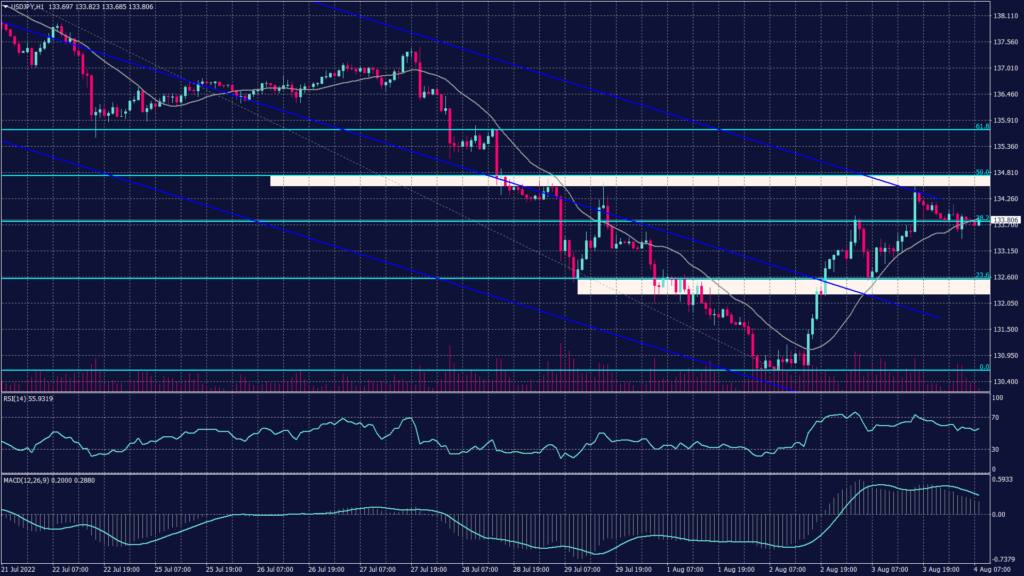
The Japanese Yen traded lower against the greenback on Wednesday after data showed a surprise pickup in the U.S. services industry in July, while hawkish comments from Federal Reserve officials this week also supported the greenback.
The Institute for Supply Management said its non-manufacturing PMI rebounded last month from June. The increase ended with three straight monthly declines. It also showed supply bottlenecks and price pressures eased and backed up the view that the economy is not in a recession.
Fed officials voiced their determination again on Wednesday to rein in high inflation, although one noted a half-percentage-point hike in the U.S. central bank’s key interest rate next month might be enough to march toward that goal.
Technically:
The hourly chart shows a continuation of the downtrend as the pair is committing to the regression channel shown in the chart above. Additionally, Fibonacci retracement signals support above 130 Yen per dollar. Meanwhile, the daily chart confirms the sharp continuation and signals a target at the previous support of 126.of 60. Technical indicators confirm the hypothesis of continuation, and the moving averages remain diverging.
PIVOT POINT: 133.20
| SUPPORT | RESISTANCE |
| 133.55 | 131.50 |
| 129.85 | 132.10 |
| 126.60 | 132.60 |
Spot Gold (XAUUSD)
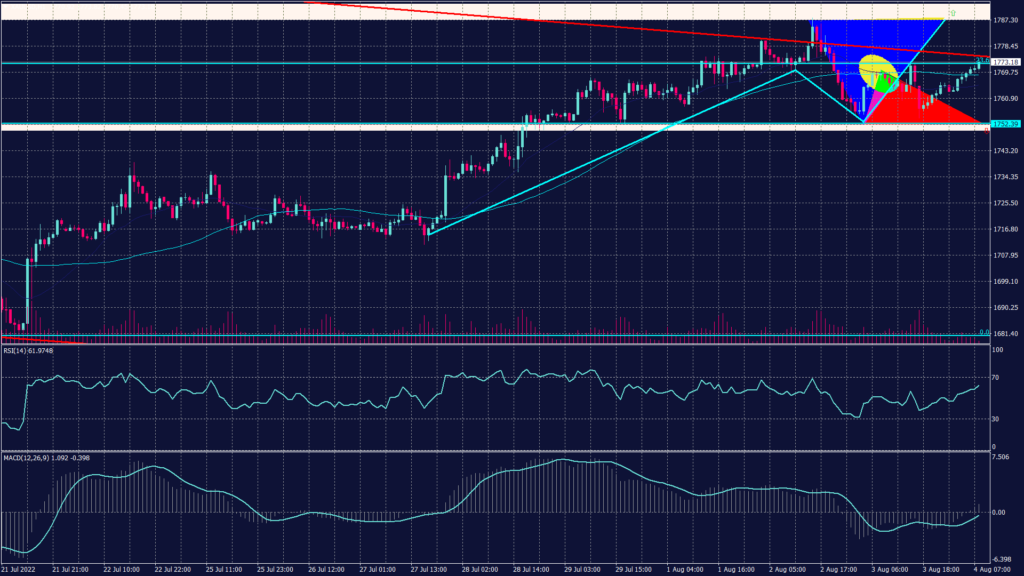
Gold traded slightly higher on Thursday, with most other precious metals marking small gains after a rally in the U.S. dollar appeared to have paused.
Spot gold was trading 0.1% higher at $1,767.41 an ounce while gold futures coped better, up 0.4% at $1,783.60 an ounce. On the other hand, platinum futures rose 0.1%, while silver futures added 0.6% after plummeting 1% over the past two days.
Technically:
The gold daily chart remains committed to the declining channel and has been trying to break above it for the past two days. Meanwhile, the hourly chart shows high volatility and wobbling below $1,770 an ounce. Additionally, the hourly chart faces resistance at 1,779, confirmed by Fibonacci retracement readings.
PIVOT POINT: 1,773
| SUPPORT | RESISTANCE |
| 1,752 | 1,779 |
| 1,745 | 1,800 |
| 1,738 | 1,810 |
West Texas Crude (USOUSD)
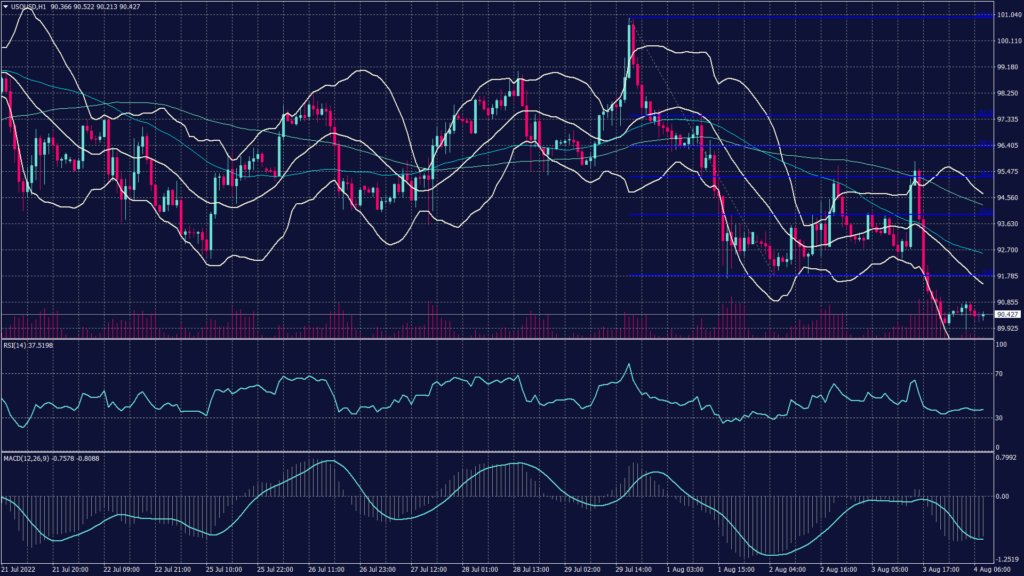
Oil prices rose on Thursday as supply concerns triggered a rebound from multi-month lows plumbed in the previous session after U.S. data signaled weak fuel demand. Brent crude futures rose 0.4% at $97.20 a barrel, while WTI crude was last up 0.5% gain at $90.15.
Both benchmarks fell to their weakest levels since February in the previous session after U.S. data showed crude and gasoline stockpiles unexpectedly surged last week and as OPEC+ agreed to raise its oil output target by 100,000 barrels per day (bpd), equal to about 0.1% of global oil demand.
WTI fell below the support at $92 per barrel to free fall below $90 a barrel. The chart shows tendency for further decline.
PIVOT POINT: 89.80
| SUPPORT | RESISTANCE |
| 89.50 | 90.85 |
| 88.90 | 92.00 |
| 85.00 | 93.35 |
Tags
Open Live Account
Please enter a valid country
No results found
No results found
Please enter a valid email
Please enter a valid verification code
1. 8-16 characters + numbers (0-9) 2. blend of letters (A-Z, a-z) 3. special characters (e.g, !a#S%^&)
Please enter the correct format
Please tick the checkbox to proceed
Please tick the checkbox to proceed
Important Notice
STARTRADER does not accept any applications from Australian residents.
To comply with regulatory requirements, clicking the button will redirect you to the STARTRADER website operated by STARTRADER PRIME GLOBAL PTY LTD (ABN 65 156 005 668), an authorized Australian Financial Services Licence holder (AFSL no. 421210) regulated by the Australian Securities and Investments Commission.
CONTINUEImportant Notice for Residents of the United Arab Emirates
In alignment with local regulatory requirements, individuals residing in the United Arab Emirates are requested to proceed via our dedicated regional platform at startrader.ae, which is operated by STARTRADER Global Financial Consultation & Financial Analysis L.L.C.. This entity is licensed by the UAE Capital Market Authority (CMA) under License No. 20200000241, and is authorised to introduce financial services and promote financial products in the UAE.
Please click the "Continue" button below to be redirected.
CONTINUEError! Please try again.

