


U.S. Dollar Index (USDX)
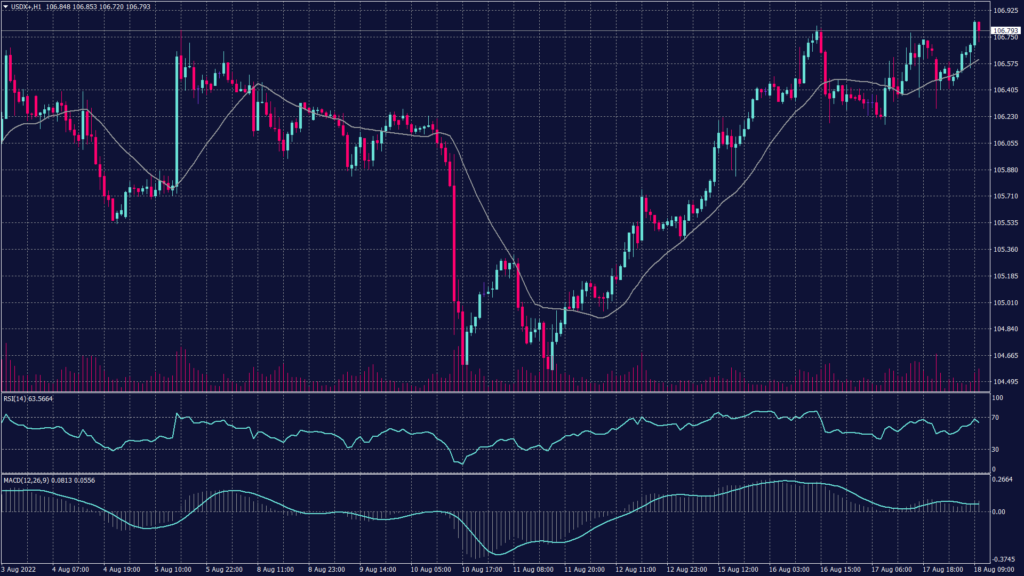
The dollar index rose after the minutes, as did Treasury yields. The Fed hiked rates by 0.75% last month, with traders now split over a 0.5% or 0.75% hike in September. While data last week did show that U.S. inflation had likely peaked, Fed members indicated that it was still far too high to consider reducing the pace of monetary policy tightening.
Meanwhile, on the daily chart, jumped to 106.90 right after breaking the previous resistance at 106.40. However, the index retreated towards 106.40 but remains positive.
PIVOT POINT: 106.60
| SUPPORT | RESISTANCE |
| 106.20 | 106.75 |
| 106.00 | 106.90 |
| 105.50 | 106.95 |
Sterling pound (GBPUSD)
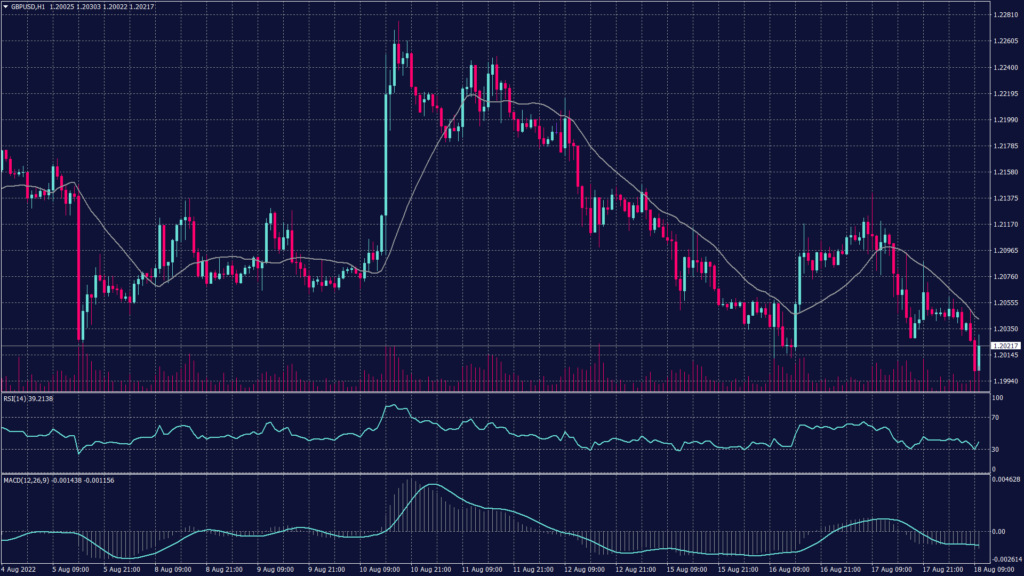
The Sterling pound fell 0.3% to 1.2010, a day after the U.K. consumer prices index climbed above 10.1% on an annual basis in July reaching the highest rate of inflation since early 1982.
The Bank of England has been raising interest rates since December in an attempt to curb the soaring inflation, but this has done little to help the cable as the more hawkish policy path comes at the expense of future growth conditions. The BOE recently warned that the country’s economy would likely enter recession in the fourth quarter, and it could last for over a year.
The sterling pound pair lost further and declined to the resistance at 1.2000 after the heavy selloff this morning. However, the daily chart remains negative after forming a minor double top pattern.
PIVOT POINT: 1.2040
| SUPPORT | RESISTANCE |
| 1.2000 | 1.2050 |
| 1.1990 | 1.2080 |
| 1.1970 | 1.2105 |
Spot Gold (XAUUSD)
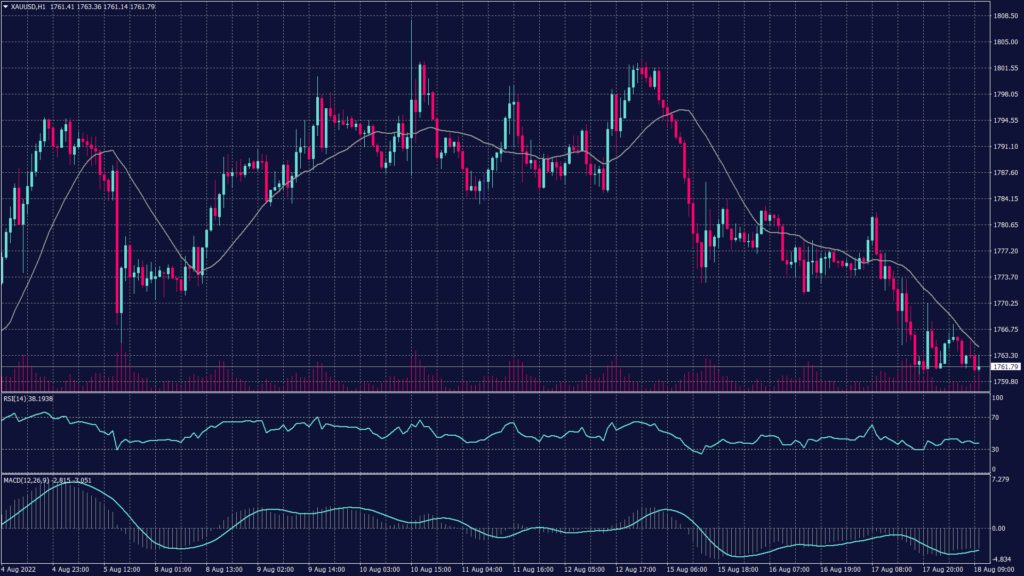
Gold prices had slipped on Wednesday after the minutes of the Federal Reserve’s July meeting showed that most members supported more rate hikes to bring down inflation.
Spot gold rose 0.2% to $1,765.65 an ounce, while gold futures rose 0.15% to $1,778.75. But both instruments were trading largely within a $1,750 to $1,810 range seen over the past two weeks.
Spot gold found support at 1,770 which kept the trading range tight between 1,772 and 1,782 per ounce. However, the long-term trend remains downwards despite the big bounce from 1,700 to 1,775.
PIVOT POINT: 1,760
| SUPPORT | RESISTANCE |
| 1,750 | 1,770 |
| 1,745 | 1,785 |
| 1,740 | 1,800 |
West Texas Crude (USOUSD)
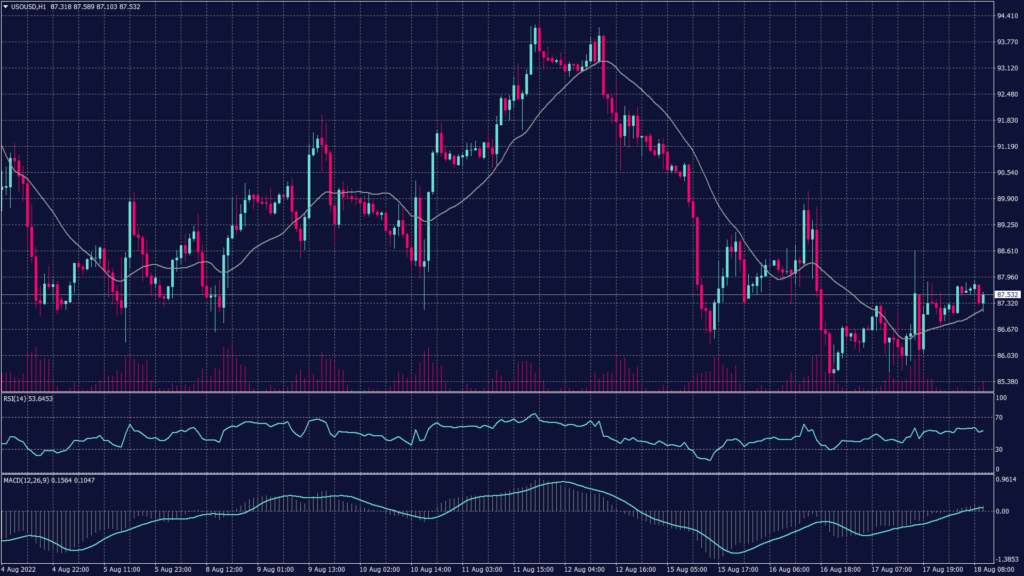
Oil prices slightly changed during the morning trades as investors digest the falling stockpiles in the United States, rising output from Russia, and worries about a potential global recession. Meanwhile, Brent futures climbed 0.2% to $93.80 a barrel, and WTI futures gained 0.1% to $88.15 a barrel.
WTI found support at $87.40 per barrel on the hourly chart which can be considered a speculative area as long as the prices haven’t dropped below $86.50 per barrel. Meanwhile, the daily chart shows a continuation of the downtrend and a high possibility of breaking towards $82.90.
PIVOT POINT: 86.50
| SUPPORT | RESISTANCE |
| 83.65 | 91.55 |
| 78.85 | 94.00 |
| 74.60 | 97.50 |
Tags
Open Live Account
Please enter a valid country
No results found
No results found
Please enter a valid email
Please enter a valid verification code
1. 8-16 characters + numbers (0-9) 2. blend of letters (A-Z, a-z) 3. special characters (e.g, !a#S%^&)
Please enter the correct format
Please tick the checkbox to proceed
Please tick the checkbox to proceed
Important Notice
STARTRADER does not accept any applications from Australian residents.
To comply with regulatory requirements, clicking the button will redirect you to the STARTRADER website operated by STARTRADER PRIME GLOBAL PTY LTD (ABN 65 156 005 668), an authorized Australian Financial Services Licence holder (AFSL no. 421210) regulated by the Australian Securities and Investments Commission.
CONTINUEImportant Notice for Residents of the United Arab Emirates
In alignment with local regulatory requirements, individuals residing in the United Arab Emirates are requested to proceed via our dedicated regional platform at startrader.ae, which is operated by STARTRADER Global Financial Consultation & Financial Analysis L.L.C.. This entity is licensed by the UAE Capital Market Authority (CMA) under License No. 20200000241, and is authorised to introduce financial services and promote financial products in the UAE.
Please click the "Continue" button below to be redirected.
CONTINUEError! Please try again.

