


The best indicators for day trading help you understand price action, momentum, and volume in real time by showing you what they mean.
But with so many analytical tools out there, how do you know which ones really help you see through the noise in the market without making your chart cluttered? Day trading indicators are math calculations that use past prices, volumes, or open interest to make predictions.
Traders use these visual tools to figure out how the market is feeling and to show possible entry or exit points. The best indicators for intraday trading can help you understand how the market is structured, but they can’t guarantee results or tell you what will happen in the future.
This guide gives you a simple, practical look at the best charting tools for beginners. You will learn what each indicator measures, how to use them in your daily analysis, and how to combine them without getting stuck in analysis paralysis.
Quick Answer
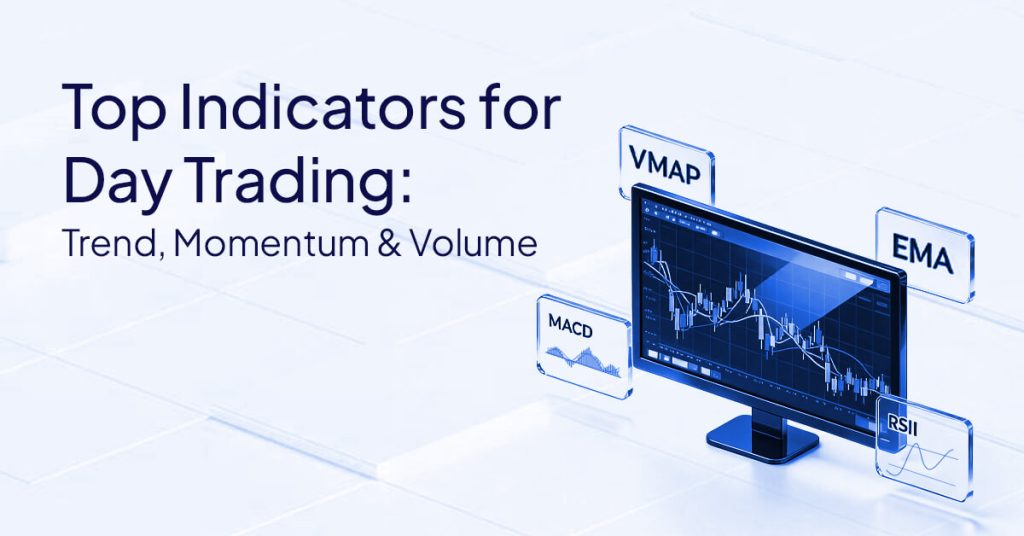
Five main tools make up the top indicators for day trading:
- Moving Averages: Keep an eye on the general direction of the trend.
- VWAP (Volume Weighted Average Price): Shows fair value by measuring the average price based on volume.
- The Relative Strength Index (RSI): Measures the speed and direction of price changes (momentum).
- MACD, or Moving Average Convergence Divergence: Shows changes in the strength and direction of a trend.
- Bollinger Bands: Show how volatile the market is and what the highest and lowest prices could be.
What Are The Top Indicators For Day Trading?
Mathematical overlays that sort market conditions into trend, momentum, volatility, and volume data are the best indicators for day trading.
Indicators turn raw price data into signals that you can see. Traders break them down into four main groups so they can use them well:
- Trend Indicators show the market’s general direction (for example, Moving Averages).
- Momentum Indicators, like the RSI, show how fast and strong a price movement is.
- Volatility Indicators show how quickly prices change (for example, Bollinger Bands).
- Volume Indicators track how strong the buying and selling pressure is (for example, VWAP).
These indicators can help you with your trading plan. The Financial Industry Regulatory Authority (FINRA) says that day trading requires a lot of knowledge about how the market works, and that technical tools should be used to control risk instead of making sure profits.
What Are The Top 5 Intraday Trading Indicators?
The top five intraday trading indicators give you a balanced view of price direction, momentum, and volume for short-term charting.
Moving Averages
Moving averages make price data easier to read by making an average price line that changes all the time. Traders use them to cut through the noise of the day and find the main trend. One common way to day trade is to wait for the price to drop back to a short-term moving average, like the 9-period EMA, and then join a trend that is already going on.
- Limitation: They don’t keep up with price changes in real time.
This is a candlestick chart with an Exponential Moving Average line on it.
VWAP
Based on both volume and price, VWAP shows the average price at which a security has traded during the day. Traders look at VWAP to see who is in charge: buyers if the price is above VWAP, and sellers if the price is below VWAP. Using the VWAP line as a dynamic support or resistance level for entry points is a common use case.
- Limitation: It resets every day of trading and becomes less sensitive as the day goes on.
RSI
The RSI shows how fast and how big recent price changes have been on a scale from 0 to 100. Traders look for conditions that are overbought (above 70) or oversold (below 30). A common intraday use case is looking for momentum divergence, which happens when the price makes a new high but the RSI makes a lower high, which could mean that the trend is about to change.
- Limitation: It can stay too bought or too sold for a long time during strong trends.
MACD
The MACD shows how two moving averages of a security’s price are related to each other. Traders use the MACD to find changes in momentum. A common way to day trade is to look for the “MACD crossover,” which happens when the MACD line crosses above the signal line, showing that the market is moving up.
- Limitation: It is a lagging indicator, which means it can give false signals in markets that are moving up and down quickly.
Bollinger Bands
Bollinger Bands are made up of a simple moving average with two standard deviation lines above and below it. They check how volatile the market is. Traders use them to find out when a market is too quiet or too stretched. A common use case is to trade the “squeeze,” which means to enter a trade when the bands get very close together and expect a big breakout.
- Limitation: During strong trends, the price can “ride the band,” which means that reversal signals may not be reliable.
Which Technical Indicators Do Day Traders Use Most?
People who day trade like the best technical indicators because they are clear, fast, and give reliable confirmation instead of making predictions.
There is no one perfect tool for everyone, but day traders tend to like indicators that are easy to read at a glance. A complicated chart makes people hesitate in fast-moving markets.
Indicators like VWAP and EMAs are very popular because they give you immediate, binary information (for example, “price is above the line, look for buys”). ETFs attract over one trillion in annual inflows, reflecting sustained global investor demand.
Traders also like tools that back up their main analysis. A trader might look at the raw price action first and then the RSI to make sure that the breakout is in line with the momentum. The tools that are used the most are still broad and market-neutral, and they work just as well on currency pairs as they do on indices.
Which Indicators Lead And Which Lag?
Leading indicators for day trading try to show price changes before they happen, while lagging indicators confirm a trend after it has already started.
Leading Indicators For Early Signals
The RSI and Stochastic Oscillator are two examples of leading indicators that measure momentum. They are made to show when a market is losing steam so that traders can get in early.
Getting in early can help you get better risk-to-reward ratios, but the main problem with leading indicators is that they often give false signals when trends are strong and steady.
Lagging Indicators For Confirmation
Moving Averages and the MACD are examples of lagging indicators that are based on past data. They don’t send a signal until the price changes. Traders use them to make sure that a trend is really happening.
Their signals are slower and might make you miss the start of a move, but they are usually better for trend continuation setups. These same lagging tools also appear frequently among the best swing trading indicators, where multi-day trend confirmation matters more than speed.
What Is The Best Trend Indicator For Day Trading?
There is no one best trend indicator for day trading. The best one for you will depend on whether you are looking at pure price averages or volume-weighted data.
Your strategy will determine which trend indicator you choose.
- Moving Averages: Great for following prices smoothly and clearly. The EMA responds quickly to changes in price, which makes it great for quick scalping.
- VWAP: It is the best tool for aligning institutions with intraday trends. A VWAP trend that includes volume is more important than a trend that doesn’t.
When the market is clearly making higher highs or lower lows, you should use a trend indicator. If the market isn’t going up or down, trend indicators will stop working and give you a flat line. You should then switch to a momentum or volatility indicator.
Which Indicator Combinations Work Best For Day Traders?
The best mix of technical indicators for day trading pairs tools from different groups to confirm signals without repeating data.
Using two momentum indicators together gives you extra information—instead, traders who do well mix different types of trades.
Trend + Momentum Combination
For example, the Moving Average and the RSI
You can tell the overall direction (like an uptrend) by looking at the Moving Average. You then use the RSI to decide when to enter. You wait for the RSI to drop back to an oversold level while the price stays above the Moving Average.
Trend + Volume Combination
For example, VWAP and volume bars
This is a classic strategy for the day. A price that goes above the VWAP shows that the trend is bullish. The volume bars confirm the move; a breakout with a lot of volume shows that a lot of buyers are interested and sure about it.
Momentum + Volatility Combination
This mix helps you find the extremes in the market. If the price hits the upper Bollinger Band (high volatility) and the RSI prints an overbought reading above 70 (peaking momentum) at the same time, it is a strong sign that the price may temporarily change direction or pull back.
Make your combinations easy. You only need two to three indicators to find confluence without making the chart too busy.
Do The Best Indicators Change By Market?
The math behind the indicators stays the same, but their effectiveness changes depending on how liquid, volatile, and busy the market is.
Best Stock Indicators For Day Trading
There are official times when stock markets open and close. The first hour after the stock market opens is very unstable because of news that came out overnight. So, volume is a big part of the best stock indicators for day trading.
VWAP is the clear leader in equity markets because institutional traders use it to figure out what a fair price is during these busy hours. Data shows that volume-weighted metrics are very important for measuring the liquidity of assets that are traded on exchanges.
Intraday Indicator Use Across Different Assets
The forex and crypto markets trade all day, every day, so there isn’t a central daily open like there is for stocks to hold volume. Understanding how indicators in forex behave around global sessions is key, volume context differs entirely from equity markets.
- Liquidity: Moving averages and trend lines work well in markets that are very liquid.
- Volatility: For slower markets, you might need sensitive momentum oscillators like Stochastics. For very volatile assets, you might need wider Bollinger Bands.
- Sessions: An EMA crossover strategy might work great during the busy London or New York overlap, but it might give false signals during the quiet Asian session.
What Mistakes Should Traders Avoid When Using Day Trading Indicators?
The most common mistake traders make is adding too many indicators to their charts, which makes them send conflicting signals and causes them to hesitate.
- Using too many indicators: Five lines on a chart make it hard to see what the price is doing.
- Using signals that don’t agree: When you pair two lagging tools or two momentum tools, you get the same data on a delay.
- Ignoring price action and volume: If the indicator says “buy” but there is a big red candlestick that shows a lot of selling, the price action should win.
- Entering trades without risk management: If you trade without a stop-loss based on an indicator cross, you could lose a lot of money. Over 85% of day traders fail in their first year due to poor risk management.
- Chasing every signal: Overtrading happens when a trader takes a position every time a line crosses. It matters what the situation is.
How Should Beginners Choose Day Trading Indicators?
People who are new to trading should start with just two indicators that do different things and test them thoroughly in a simulated environment.
To build a strong base, use the right tool for the job. Pick one indicator to show the trend (like an EMA) and another to tell you when to get in or measure volatility (like the RSI).
When you practice on a trading platform with real-time data, you can see how these indicators work in real time. Before using real money, always try out your strategies in a demo simulator.
Platforms like STARTRADER offer live accounts where you can apply these indicators in real market conditions with full analytical tools.
This lets you learn about the indicator’s quirks, like how much an EMA lags when there is a sudden news spike, without putting your money at risk. If you want to use these tools in real time, consider looking into getting a live account so you can see how the market works in real time.
What Should Traders Check Before Acting On An Indicator Signal?
Traders must check off a strict list of things before they trade based on an indicator to make sure the market context matches the signal.
Don’t just buy a MACD crossover. This quick list will help you:
- Trend direction: Does the overall market trend support this signal?
- Volume confirmation: Is there enough volume to keep the move going?
- Conditions for volatility: Is the market moving enough to reach a profit goal?
- Entry level: Is the entry point a good risk-to-reward ratio?
- Stop-loss placement: If the indicator is wrong, where is the best place to leave?
- Position size: Is the trade the right size for the level of risk you are willing to take?
FAQs
Moving Averages, VWAP, the Relative Strength Index (RSI), MACD, and Bollinger Bands are some of the best indicators for day trading. Traders can use these tools to find trends, measure momentum, and find volume anomalies.
There isn’t one best indicator for intraday trading. Still, VWAP is often thought to be the best for looking at intraday volume because it takes into account both price and heavily traded zones to find intraday fair value.
Day traders often use moving averages to find the path of least resistance, and the RSI is used to find overbought or oversold conditions during pullbacks.
The Exponential Moving Average (EMA) is a popular choice for day trading because it reacts to recent price changes much faster than the Simple Moving Average (SMA).
Conclusion
The first step to making a strong intraday strategy is to know what each indicator measures.
Moving Averages and the RSI are two of the best indicators for day trading. They help you figure out the direction of the trend and the momentum.
Keep your charts neat, don’t mix tools from different categories to avoid duplicating data, and stay disciplined. Most importantly, keep in mind that indicators are just math that show how prices and volumes have changed in the past. They are meant to help you analyze the market, not make decisions and manage risk on your own.
Tags
Open Live Account
Please enter a valid country
No results found
No results found
Please enter a valid email
Please enter a valid verification code
1. 8-16 characters + numbers (0-9) 2. blend of letters (A-Z, a-z) 3. special characters (e.g, !a#S%^&)
Please enter the correct format
Please tick the checkbox to proceed
Please tick the checkbox to proceed
Important Notice
STARTRADER does not accept any applications from Australian residents.
To comply with regulatory requirements, clicking the button will redirect you to the STARTRADER website operated by STARTRADER PRIME GLOBAL PTY LTD (ABN 65 156 005 668), an authorized Australian Financial Services Licence holder (AFSL no. 421210) regulated by the Australian Securities and Investments Commission.
CONTINUEImportant Notice for Residents of the United Arab Emirates
In alignment with local regulatory requirements, individuals residing in the United Arab Emirates are requested to proceed via our dedicated regional platform at startrader.ae, which is operated by STARTRADER Global Financial Consultation & Financial Analysis L.L.C.. This entity is licensed by the UAE Capital Market Authority (CMA) under License No. 20200000241, and is authorised to introduce financial services and promote financial products in the UAE.
Please click the "Continue" button below to be redirected.
CONTINUEError! Please try again.

