








 Web Trader MT5








Financial markets experienced a volatile month in July, as investors navigated persistent geopolitical tensions in the Middle East, renewed inflation concerns, corporate earnings, and shifting expectations for Federal Reserve policy. The US dollar closed lower in July, ending the month down 1.4% despite higher oil prices and elevated levels of inflation. However, cooling CPI reduced the chances of a rate hike in September, pressuring the US dollar.
US Stock Markets
US equities ended July on a mixed note despite heightened volatility. The Dow Jones Industrial Average gained approximately 0.35% during the month, reaching fresh record highs, while the S&P 500 closed 0.1% lower. The Nasdaq 100 dropped more than 6%.
Amazon briefly surpassed a $3 trillion market capitalization in early August, while Nvidia, Meta, Microsoft and Alphabet all posted solid gains. Investors were also encouraged by stronger-than-expected US economic data, particularly manufacturing activity, which suggested the economy remained resilient despite higher interest rates.
Dow Jones Technical Analysis
The Dow Jones remains in a well-defined long-term uptrend, with price continuing to print higher highs and higher lows. The index recently reached a fresh record high around 54,800, confirming that buyers remain firmly in control.
Although the latest candles show some hesitation near all-time highs, the moving averages remain positively aligned, with the 5-day average above the 10-day and both comfortably above the rising 20-day average. This suggests that the current weakness is more likely a period of consolidation.
Bias remains Bullish while holding above 53,500. A sustained breakout above 54,800 would reinforce the broader uptrend.
Dow Jones Daily Chart
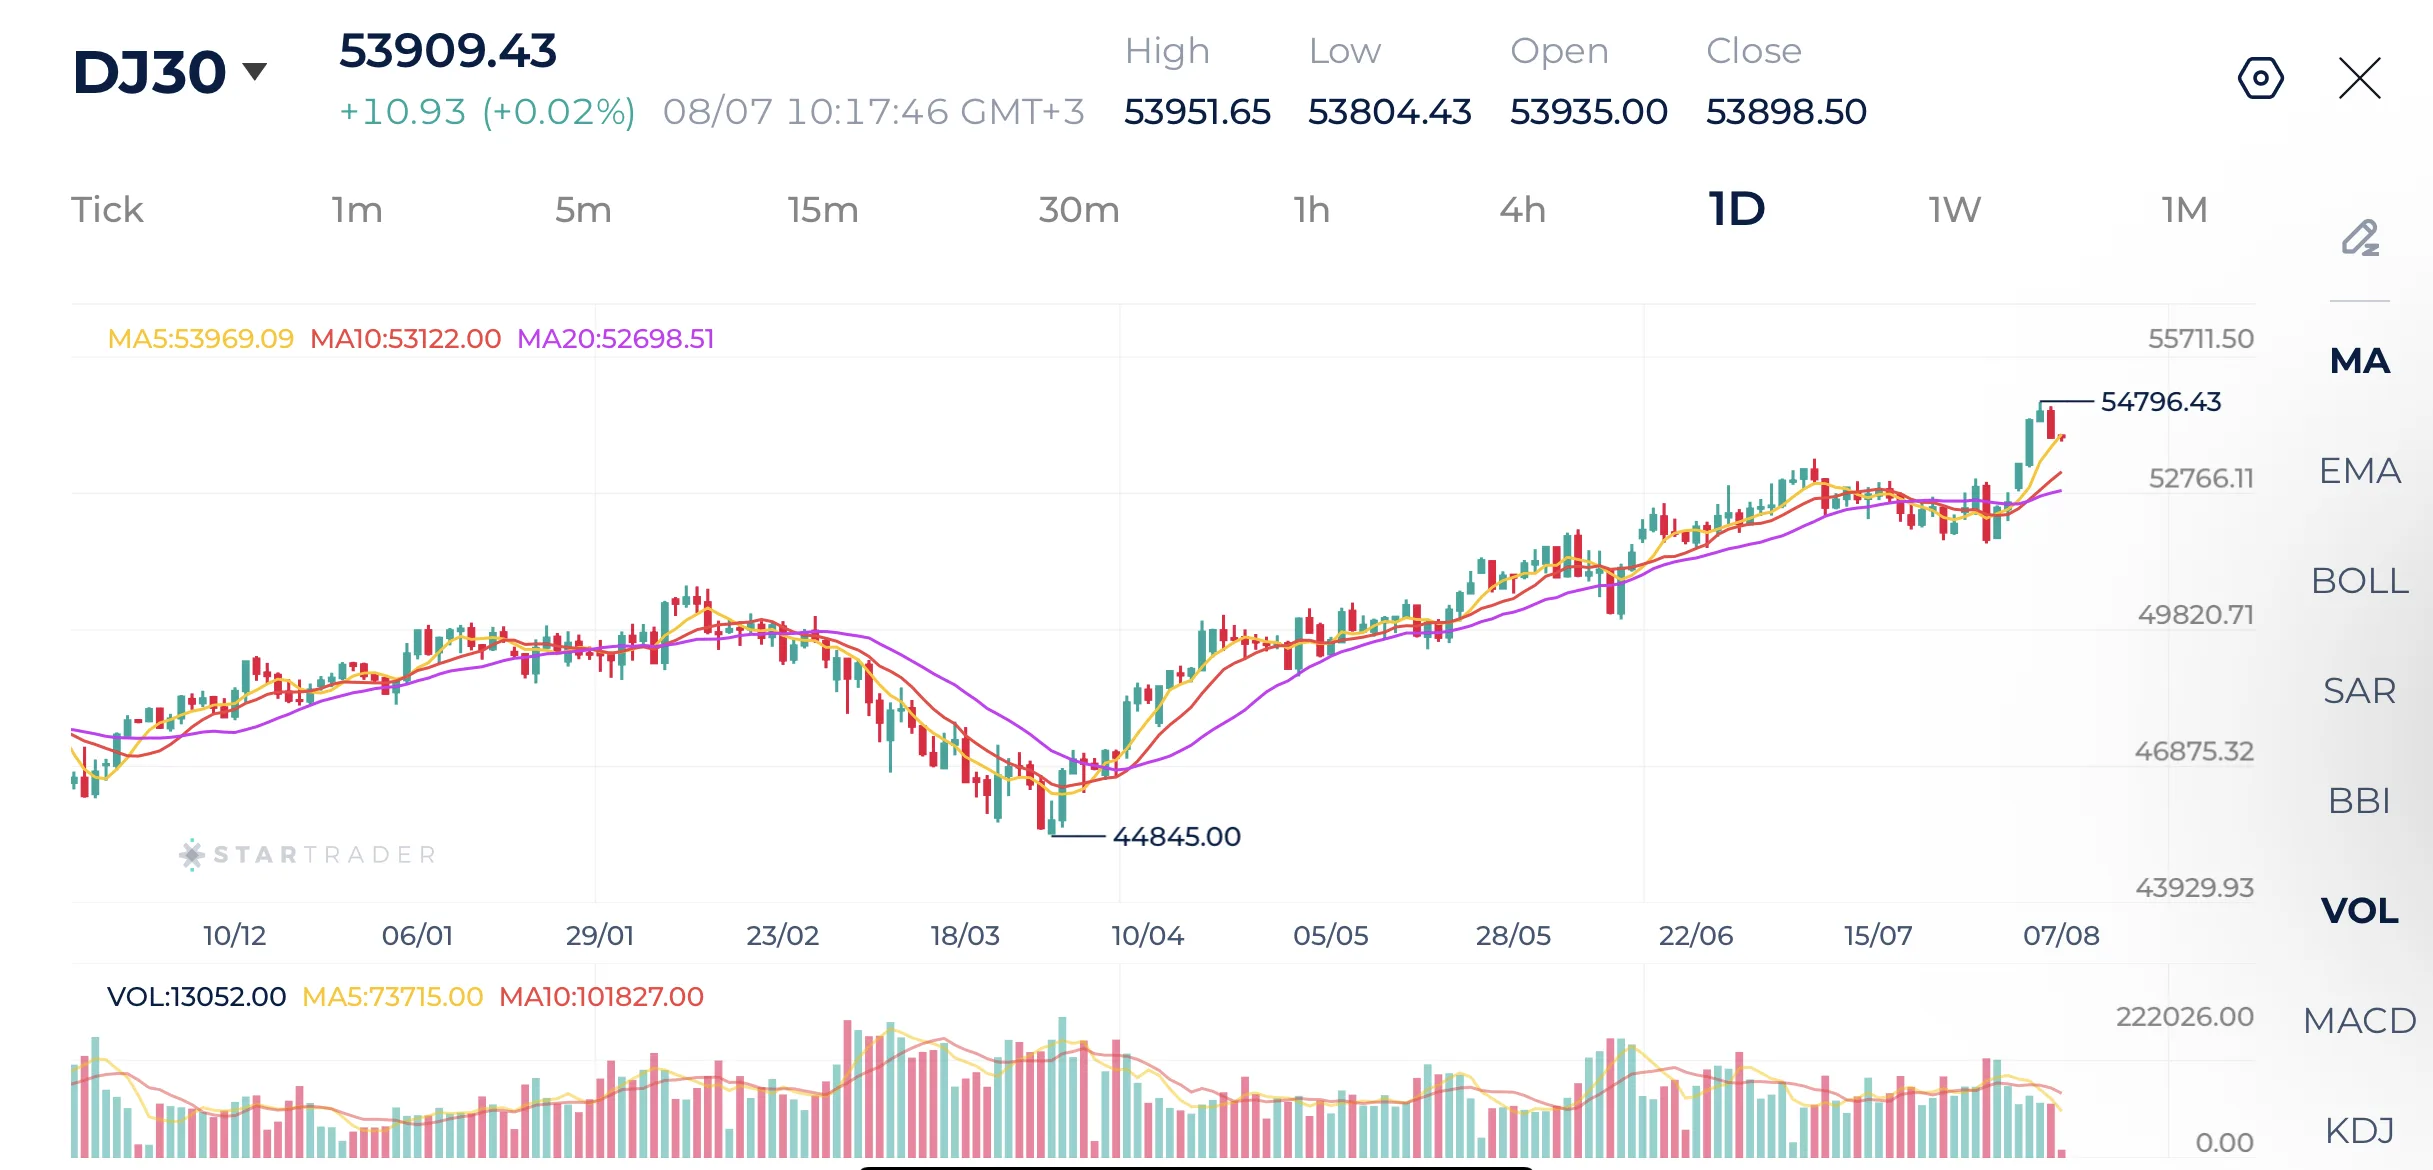
Source: STARTRADER app | Dow Jones breaks a new record high as investor optimism grows
| Resistance | 54,700 – 54,730 | 55,000 – 55,020 | 55,140 – 55,150 |
|---|---|---|---|
| Support | 53,373 – 53,390 | 52,305 – 52,320 | 51,510 – 51,520 |
Gold
Gold traded in a wide range throughout July as investors balanced safe-haven demand against expectations of tighter monetary policy. The precious metal reached a high of $4,200 per ounce during the month.
Concerns surrounding the US-Iran conflict and uncertainty over the Strait of Hormuz supported oil prices and pressured gold. Additionally, stronger US economic data, a rebound in the US dollar, and rising expectations that the Federal Reserve could resume tightening later this year pressured the precious metal. By the end of the month, markets were increasingly focused on upcoming US labor market data and inflation indicators for additional clues on the Fed’s next move.
Gold Technical Analysis
Gold has staged a strong recovery after forming a medium-term bottom near $3,943, ending the multi-month corrective phase. The recent breakout above the 20-day moving average and the subsequent move above both the 5-day and 10-day moving averages indicate that bullish momentum is returning. The moving averages are beginning to turn higher, suggesting the uptrend is gradually rebuilding.
However, after rallying toward $4,300, price is approaching a key resistance zone that previously acted as an important support area during the broader correction. Some profit-taking or short-term consolidation would therefore be healthy before another leg higher.
The medium-term outlook remains constructive as long as gold holds above the 20-day moving average around $4,080-$4,100.
Gold Daily Chart
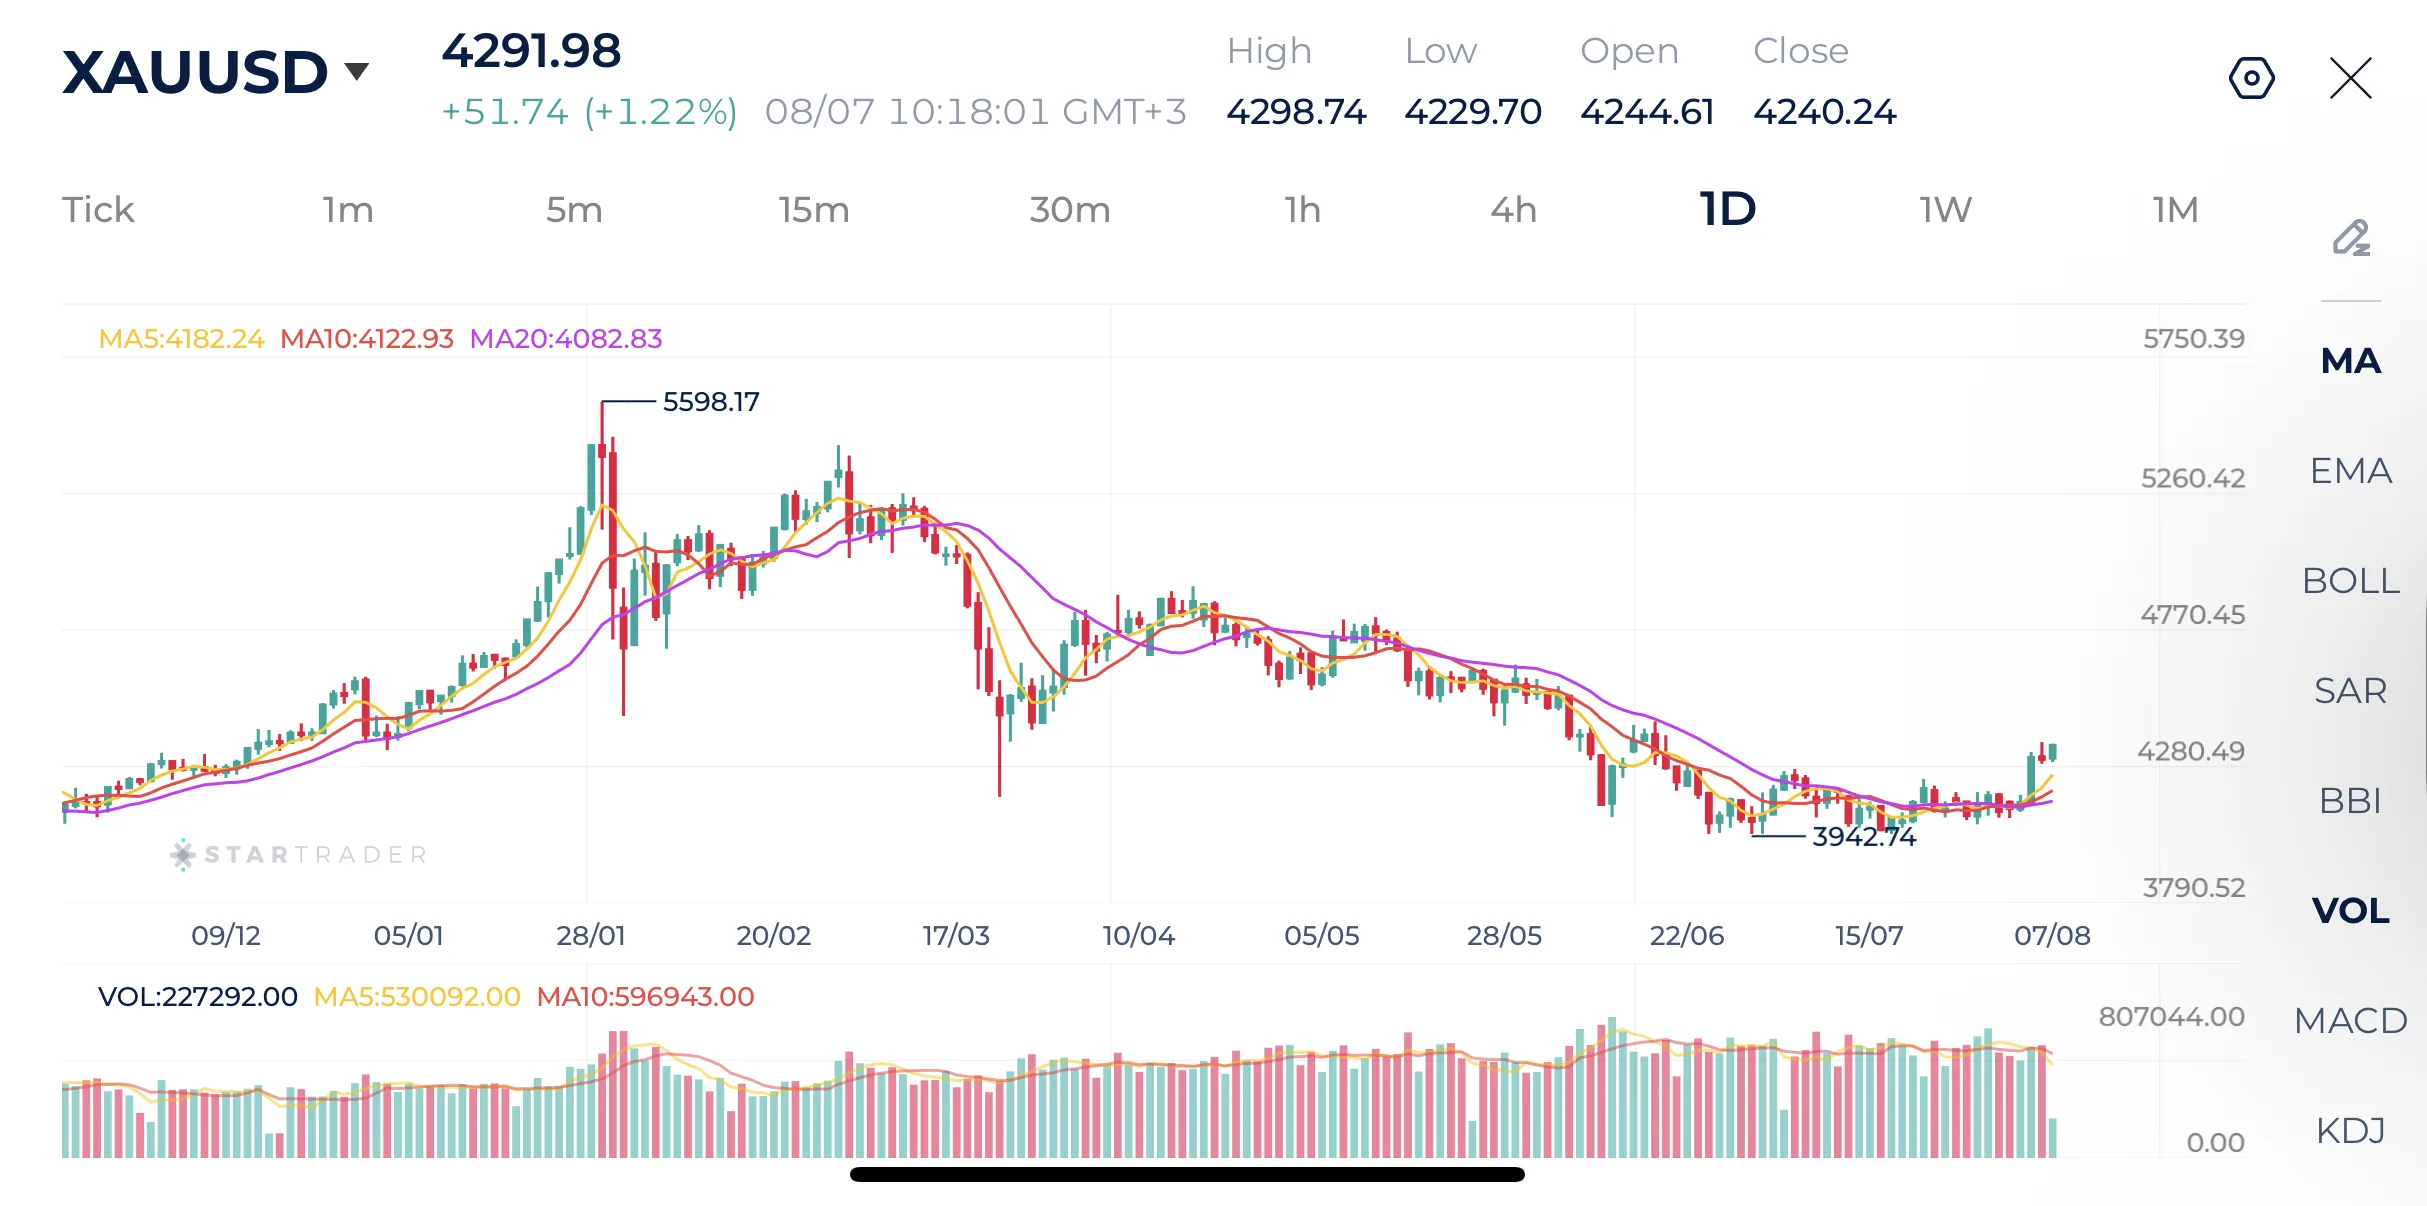
Source: STARTRADER app | Gold rebounds above $4,300 following weak employment numbers
| Resistance | $4,384 – $4,395 | $4,434 – $4,450 | $4,595 – $4,600 |
|---|---|---|---|
| Support | $4,173 – $4,190 | $4,075 – $4,090 | $3,942 – $3,950 |
Oil
Oil prices have experienced one of their best performing months in recent years. Crude oil initially surged amid fears that the conflict between the United States and Iran could disrupt supplies through the Strait of Hormuz, one of the world’s most important energy shipping routes. By the end of the month, crude brent closed 28% higher.
Brent Technical Analysis
Brent crude remains under pressure following the failure to sustain gains above $90.00. And although a recovery developed from the June lows, the latest decline suggests bullish momentum is fading again.
Price has slipped below the 5-day and 10-day moving averages, while the 20-day moving average continues to trend lower, highlighting that the broader trend remains negative. The recent candles also show repeated rejection around the 90.00 region, reinforcing it as a significant resistance level.
Bias is neutral to bearish while below $90.00. A decisive break below $82.00 would strengthen downside momentum, whereas a recovery above $90.00 would be needed to signal a more meaningful trend reversal.
Brent Daily Chart
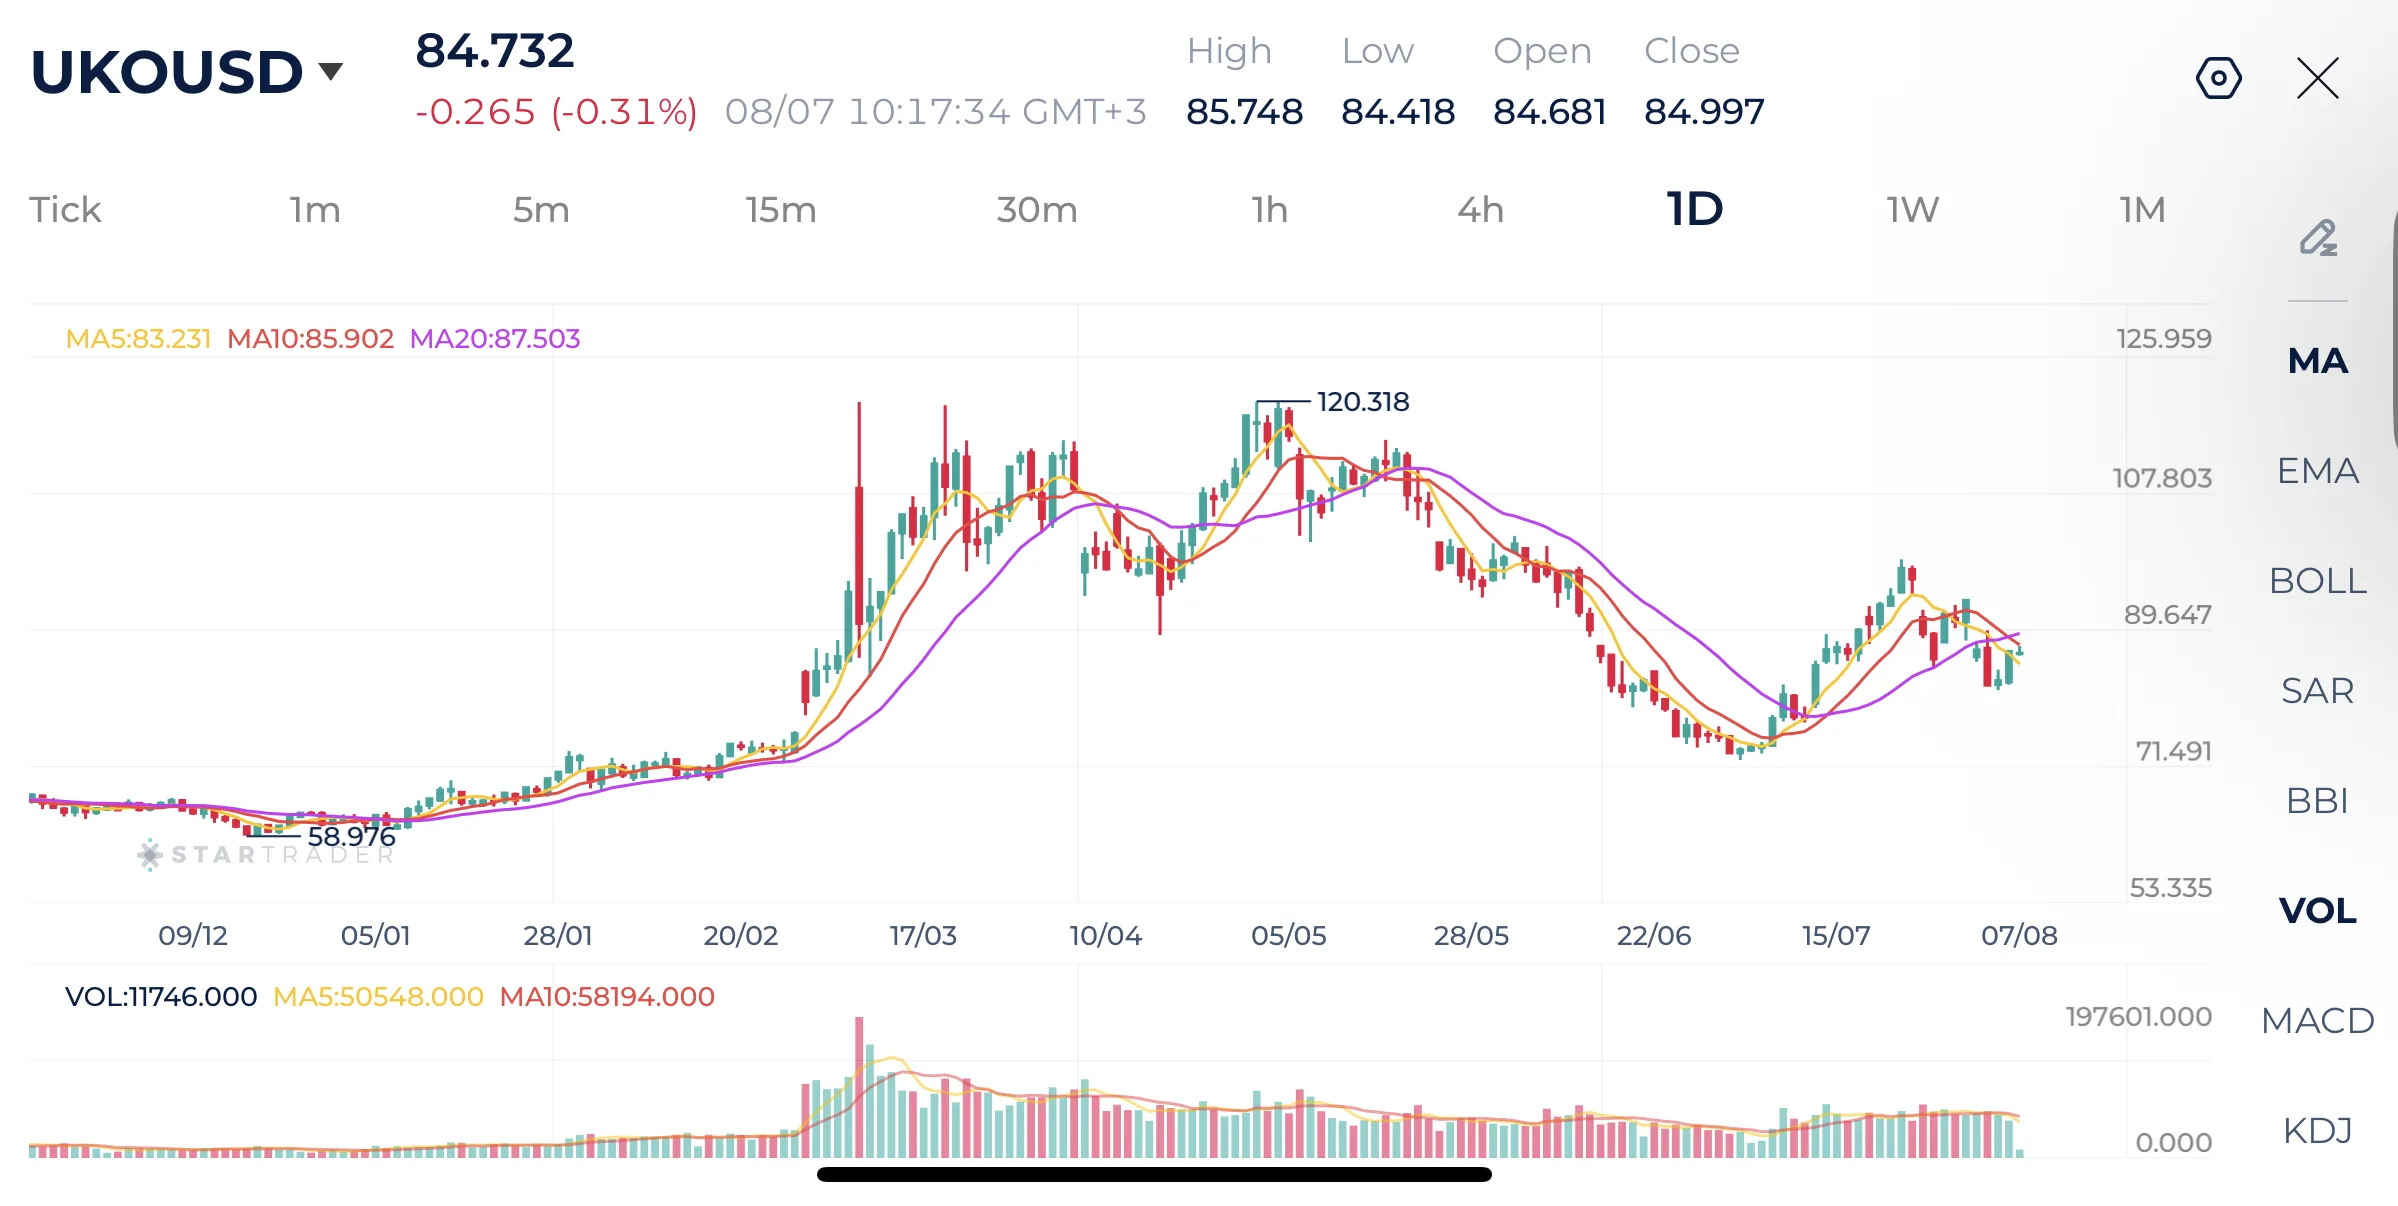
Source: STARTRADER app | Oil prices face pressure as brent falls below $80 a barrel
| Resistance | $90.00 – $90.20 | $91.64 – $91.75 | $93.80 – $93.90 |
|---|---|---|---|
| Support | $86.33 – $86.50 | $82.90 – $83.00 | $81.50 – $81.60 |
Outlook
Looking ahead to August, investors are expected to focus on the US labor market, inflation data, and the annual Jackson Hole Symposium, where Federal Reserve officials may provide important guidance on the future path of monetary policy. Geopolitical developments in the Middle East, movements in oil prices, and continued corporate earnings will also remain key drivers of market sentiment. Overall, while economic fundamentals continue to support risk assets, elevated inflation and geopolitical uncertainty suggest market volatility is likely to remain high.
Tags


Open Live Account
 Email Address
 Phone Number
Important Notice
STARTRADER does not accept any applications from Australian residents.
To comply with regulatory requirements, clicking the button will redirect you to the STARTRADER website operated by STARTRADER PRIME GLOBAL PTY LTD (ABN 65 156 005 668), an authorized Australian Financial Services Licence holder (AFSL no. 421210) regulated by the Australian Securities and Investments Commission.
Important Notice for Residents of the United Arab Emirates
In alignment with local regulatory requirements, individuals residing in the United Arab Emirates are requested to proceed via our dedicated regional platform at startrader.ae, which is operated by STARTRADER Global Financial Consultation & Financial Analysis L.L.C.. This entity is licensed by the UAE Capital Market Authority (CMA) under License No. 20200000241, and is authorised to introduce financial services and promote financial products in the UAE.
Please click the "Continue" button below to be redirected.


