








 Web Trader MT5









Key Takeaways
- January was marked by extreme volatility across asset classes, as markets transitioned from year end optimism into a sharp risk-off environment.
- Precious metals reached historic record highs early in the month, before suffering sharp corrective pullbacks toward month end.
- U.S. equity markets initially rallied, with the S&P 500 briefly reaching the 7,000 level, before experiencing a major sell-off in the final week of January.
- Cryptocurrencies collapsed late in the month, with Bitcoin falling toward $80,000 after strong selling pressure and forced liquidation.
- The Federal Reserve kept interest rates unchanged, reinforcing a cautious, data-dependent stance and disappointing expectations of near-term easing.
- Geopolitical risks intensified, particularly around U.S.–Iran relations, fueling oil price volatility and contributing to broader market uncertainty.
- Risk sentiment deteriorated sharply, prompting a rotation away from high-beta assets toward cash and defensive positioning.
Precious Metals Record Highs Followed by Sharp Correction
Fundamental Outlook
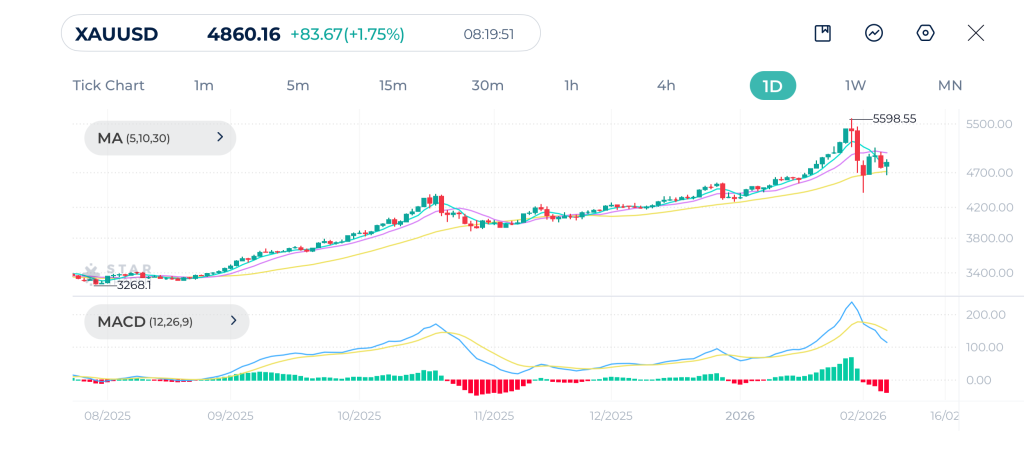
Gold experienced one of its most volatile months on record. Prices surged to new all-time highs near $5,600 in January, driven by safe haven demand and dollar weakness. However, aggressive profit-taking emerged toward the end of the month, pulling gold back toward $4,400
On a monthly basis, gold still finished January higher by approximately 13%, despite the sharp late month correction. Volatility remained elevated, reflecting uncertainty around inflation expectations, monetary policy, and geopolitical developments.
Silver significantly outperformed gold during the first half of the month, reaching record highs above $120 supported by strong industrial demand and speculative inflows. However, silver also saw a steeper correction, falling back toward $85 by month end. Despite this pullback, silver closed January up roughly 17%, underscoring its strong relative performance but also its higher volatility profile.
Technical Forecast
Gold continues to trade within a well established long term uptrend; however, recent price behavior points to a sharp corrective phase following the explosive rally toward $5,600. The strong rejection from that peak triggered a swift pullback, yet prices remain comfortably above previous key breakout zones, preserving the broader bullish framework.
Trend structure remains constructive, with moving averages still aligned to the upside. The 30-day moving average is rising, and price action continues to hold above it, which keeps the primary trend positive.
While short-term momentum has weakened, there is no evidence of a structural trend breakdown. The MACD has turned lower and moved into negative territory, reflecting the strength of the correction, but it remains well above the extreme lows typically associated with bearish trend reversals.
This suggests consolidation of gains. A renewed bullish continuation would be signaled by the MACD stabilizing and curling higher while price holds above key support levels.
Cryptocurrencies From Stability to Capitulation
Fundamental Outlook
The cryptocurrency market started January in a relatively stable manner but collapsed sharply in the final week of the month. Bitcoin fell from levels above $90,000 to near $75,000, ending January down approximately 9.4%.
Ethereum underperformed Bitcoin, sliding from above $3,000 to around $2,450, marking a monthly decline of nearly 17%. The sell-off was driven by deteriorating risk sentiment, reduced liquidity expectations, and largescale liquidations across derivatives markets.
Altcoins suffered even deeper losses, with several major tokens declining 20–30% during the month. Overall crypto market capitalization fell by an estimated 14%, highlighting the sector’s vulnerability during periods of macro driven risk aversion.
Technical Forecast
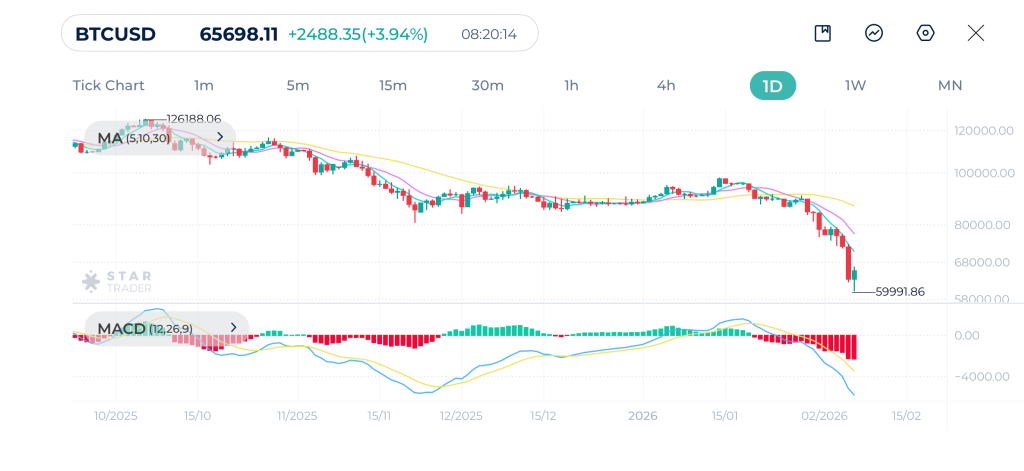
Bitcoin continues to trade within a clearly defined medium term downtrend, despite the sharp rebound from the $60,000 support zone. While the recent bullish candle was strong, it remains structurally a reactive bounce following an aggressive sell-off.
Price action remains well below prior major highs and has not yet recovered any key bullish structure on the daily chart. From a moving-average standpoint, bearish conditions persist. Although the 5-day and 10-day moving averages have begun to turn higher, price remains below the declining 30-day moving average, which continues to function as dynamic resistance.
Until Bitcoin can achieve multiple daily closes above the 30-day moving average, the current advance should be viewed as a corrective rally within a broader bearish trend. Momentum indicators align with this assessment: the MACD remains deeply negative, with no bullish crossover in place. While selling pressure is easing, sellers still retain control. A confirmed trend shift would require both a bullish MACD crossover and a sustained recovery above the 30-day moving average.
U.S. Stock Markets & Earnings
Fundamental Outlook
U.S. equity markets experienced a strong start but a weak finish to January. The S&P 500 briefly reached the 7,000 milestone, supported by optimism around earnings and easing financial conditions, before reversing sharply in the final week.
By month end, the S&P 500 finished January upapproximately 1.9%. Nasdaq-100 rose around 1.2%, weighed down by technology and AI-related stocks. Dow Jones Industrial Average rose around 1.5%, supported by defensive sectors
Earnings season delivered mixed results. While several large companies beat revenue expectations, forward guidance was cautious, particularly among technology firms.
Technical Forecast
The S&P 500 remains firmly positioned within a dominant long-term uptrend, though recent price action indicates waning momentum near the 7,017 resistance area. Repeated failures at this level highlight growing difficulty for buyers to push prices higher, increasing the likelihood of consolidation or a deeper retracement.
From a trend perspective, conditions remain technically bullish, as price continues to trade above the 30-day moving average. However, the flattening of the 5-day and 10-day moving averages points to slowing upside momentum.
A decisive break below the 30-day moving average would represent the first meaningful signal of a broader corrective phase on the daily timeframe. Momentum indicators support a cautious outlook: the MACD has rolled over and is hovering near the zero line, signaling fading bullish momentum. This configuration often precedes sideways price action or a corrective move.
Tuesday, 3 February: Interest Rate Decision | Australia
Wednesday, 4 February: Unemployment Rate | New Zealand
Thursday, 5 February: Interest Rate Decision | UK
Thursday, 5 February: Interest Rate Decision | Euro
Friday, 6 February: Unemployment Rate | Canada
Tuesday, 10 February: Retail Sales | USA
Wednesday, 11 February: Non-Farm Employment Change | USA
Friday, 13 February: Consumer Price Index | USA
Tuesday, 17 February: Consumer Price Index | Canada
Wednesday, 18 February: Interest Rate Decision | New Zealand
Wednesday, 18 February: Consumer Price Index | UK
Wednesday, 18 February: FOMC Meeting Minutes | USA
Thursday, 19 February: Unemployment Rate | Australia
Friday, 20 February: Retail Sales m/m | UK
Friday, 20 February: Advance GDP q/q | USA
Friday, 20 February: Core PCE Price Index m/m | USA
Wednesday, 27 February: Consumer Price Index | Australia
Friday, 29 February: Producer Price Index | USA
Tags


Open Live Account
 Email Address
 Phone Number
Important Notice
STARTRADER does not accept any applications from Australian residents.
To comply with regulatory requirements, clicking the button will redirect you to the STARTRADER website operated by STARTRADER PRIME GLOBAL PTY LTD (ABN 65 156 005 668), an authorized Australian Financial Services Licence holder (AFSL no. 421210) regulated by the Australian Securities and Investments Commission.
Important Notice for Residents of the United Arab Emirates
In alignment with local regulatory requirements, individuals residing in the United Arab Emirates are requested to proceed via our dedicated regional platform at startrader.ae, which is operated by STARTRADER Global Financial Consultation & Financial Analysis L.L.C.. This entity is licensed by the UAE Capital Market Authority (CMA) under License No. 20200000241, and is authorised to introduce financial services and promote financial products in the UAE.
Please click the "Continue" button below to be redirected.


