








 Web Trader MT5









Key Takeaways
- Dovish comments from Federal Reserve officials push markets to price in a high probability of a rate cut in December.
- Rise in precious metals on rate-cut hopes and weaker dollar. Both gold and silver rallied mid-week as rate-cut expectations boosted demand for non-yielding assets.
- Strong rebound in US equities, led by tech, on improved sentiment. Markets rallied, especially in tech, as investors became more optimistic about growth and lower rates.
- Volatile but positive week for crypto. Sharp bounce after prior sell-off. Cryptocurrencies saw renewed interest and rebounds after earlier losses.
Gold and silver rise sharply as the US dollar weakens
Gold had a strong week, supported by growing expectations that the Fed will cut interest rates in December. On Monday, November 24th, the precious metal rose over 1%, as traders reacted to dovish signals and awaited key US economic data.
As the week progressed, the dollar weakened and liquidity conditions softened, which further boosted demand for gold. By the end of the week, gold was up nearly 3% breaking above $4,194 per ounce, and on track for a fourth consecutive monthly gain.
Silver also benefited from the same dynamics. Prices rose almost 8% during the week, breaking above $54 per ounce, helped by the weaker dollar and increasing appeal for non-yielding metals.
Overall, gold and silver’s performance reflect a broader market mood in anticipation of looser US monetary policy.
US markets recover and push closer to previous record highs
The US stock market ended the week on a high note. On November 24, the S&P 500 rose about 1.5%, the Nasdaq 100 jumped 2.7%, and the Dow Jones Industrial Average rose 0.4%. The rally was driven by optimism over a possible December rate cut and strong gains in key tech stocks such as Alphabet.
Tech’s strong performance, after a period of pressure on AI-linked and high-valuation names, helped lift overall market sentiment. The rally reflected that investors were rotating back into risk assets, betting on easier monetary policy and renewed growth prospects.
In the forex market, the US dollar index (DXY) came under pressure mid-week as markets ramped up expectations for a Fed rate cut. That weakness, in turn, supported more dollar-sensitive assets.
EUR/USD rose 0.6% during the week, breaking above the 1.1600 level. Overall, the week’s backdrop of rising rate-cut odds, a softer dollar, and renewed risk appetite among investors renewed life for major currencies setting a potentially bullish tone for markets heading into December.
Bitcoin jumps back above $91,000, and Ethereum recaptures $3,000
After a tough period of declines, the crypto market saw signs of stabilization and renewed interest this week. According to market data, the total crypto market capitalization rose modestly, and major coins posted solid gains.
Most notably, Bitcoin surged over 5% during the week, and broke above the $91,000 mark, a strong rebound from recent lows.
Similarly, Ethereum managed to break back above the $3,000 threshold, reflecting a broader bounce in crypto risk sentiment after weeks of continuous pressure.
XRP was trading around $2.04–$2.24 during the week, with bullish sentiment aiming for a potential retest of $2.35.
From a technical and macro-structure standpoint, the rebound appears partly driven by a combination of factors, including oversold conditions post-selloff, improved assumptions around central-bank easing, and selective institutional flows. This mix gives at least a short-term bullish tailwind, but the risk remains high due to macro volatility, interest-rate uncertainty and the still-narrow focus on major tokens.
Overall, the crypto market remains sensitive to macroeconomic signals (interest-rate expectations, liquidity, ETF flows) and to global risk sentiment. This underscores the importance for traders/investors of watching both macro and idiosyncratic developments (for each coin) before positioning.
Key Economic Data of the week
- German IFO Business Climate show a minor decline to 88.1 from previous numbers of 88.4
- ADP Weekly Employment numbers show job losses of 13.5K per week for the past four weeks.
- Monthly retail sales in the US show an increase of 0.3%, in line with expectations.
- US Producer Price Index numbers come higher than expected at 0.3% on a monthly level, from -0.1%
- US consumer confidence fell to 88.7 from 95.5 in the previous month
- Australian CPI numbers jumped to 3.8%, higher than expectations of 3.6%
- Reserve Bank of New Zealand cut rates to 2.25% in line with market expectations.
- New Zealand Retail Sales increased 1.9%, higher than forecasted numbers of 0.6%
Major Economic Calendar Events for the Upcoming Week
| Date | Metric | Country | Previous | Time(Dubai) |
| Monday, 1 December | Employment Cost Index q/q | USA | 0.90% | 5:30 PM |
| Monday, 1 December | ISM Manufacturing PMI | USA | 48.7 | 7:00 PM |
| Tuesday, 2 December | CPI Flash Estimate y/y | Euro | 2.10% | 2:00 PM |
| Wednesday, 3 December | Gross Domestic Product q/q | Australia | 0.60% | 4:30 AM |
| Wednesday, 3 December | Consumer Price Index m/m | Switzerland | -0.30% | 11:30 AM |
| Wednesday, 3 December | ADP Non-Farm Employment Change | USA | 42K | 5:15 PM |
| Wednesday, 3 December | ISM Services PMI | USA | 52.4 | 7:00 PM |
| Thursday, 4 December | Unemployment Claims | USA | 5:30 PM | |
| Thursday, 4 December | Ivey PMI | Canada | 52.4 | 7:00 PM |
| Thursday, 4 December | New Home Sales | USA | Tentative | |
| Friday, 5 December | Unemployment Rate | Canada | 6.90% | 5:30 PM |
| Friday, 5 December | Core PCE Price Index m/m | USA | 0.20% | 7:00 PM |
| Friday, 5 December | Preliminary Consumer Sentiment | USA | 51 | 7:00 PM |
| Friday, 5 December | Preliminary Inflation Expectations | USA | 4.50% | 7:00 PM |
Technical Analysis and Forecast:
Nasdaq 100 Technical Analysis
The daily chart on Nasdaq 100 shows a rebound, moving up from the recent low and forming a higher low. Price is currently trading above the short-term moving averages MA(5) and MA(10) on the daily chart, but below the longer-term 30-day moving average. Crossing back above the long-term moving average would strengthen the bullish rebound signal
The 5-day moving average has crossed back above the 10-day moving average, which is a short-term bullish crossover.
MACD line has recently crossed above the signal line, generating a bullish crossover signal.
The Nasdaq daily chart shows a strong bullish rebound following a significant November correction. The price has reclaimed the short-term MAs, and the MACD has issued a bullish crossover. The key resistance to watch is the 30-day moving average and the prior all-time high around 26,260
Nasdaq 100 Daily Chart
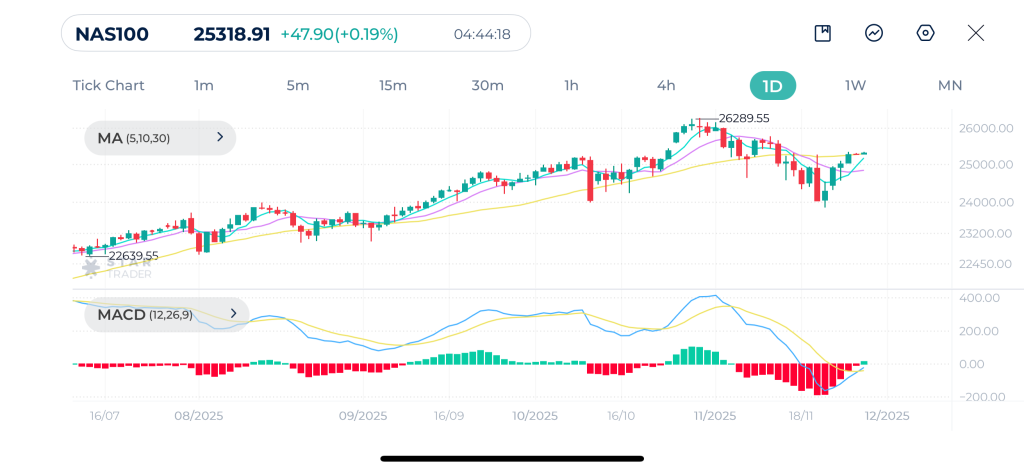
| Resistance | 25,663 – 25,681 | 25,873 – 25,895 | 26,223 – 26,257 |
| Support | 24,861 – 24,872 | 24,453 – 24,412 | 23,831 – 23,864 |
Gold Technical Analysis
Gold has recovered during the week, and is now trading above all three moving averages MA(5), MA(10), and MA(30), with the moving averages converging and pointing upwards. This suggests the long-term uptrend is resuming.
The MACD line has recently crossed above the signal line, confirming the return of strong buying momentum after the correction.
Gold seems to be continuing its uptrend. The recent correction appears to have been completed, and the bullish alignment in moving averages and MACD crossover indicate a high probability of a continuation move toward retesting the previous high of $4,381 and potentially higher.
Gold Daily Chart
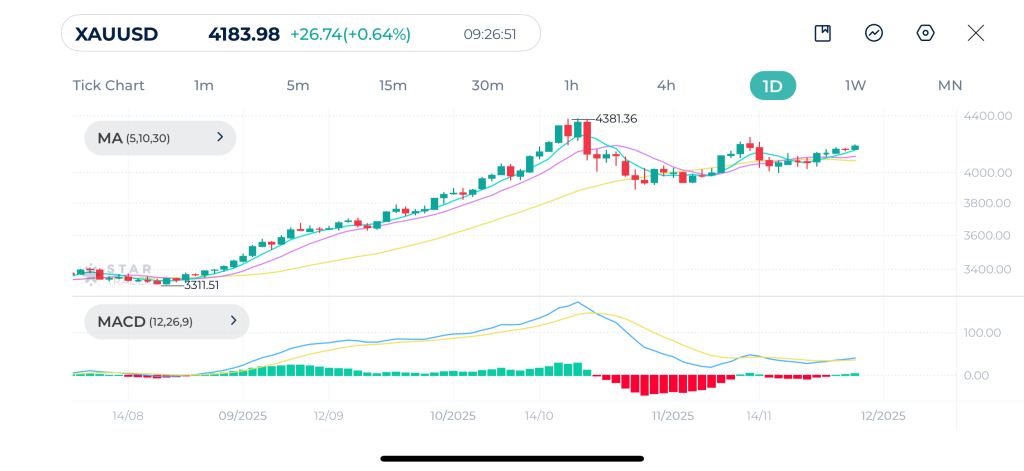
| Resistance | $4,246 – $4,257 | $4,317 – $4,326 | $4,382 – $4,397 |
| Support | $4,100 – $4,116 | $4,019 – $4,028 | $3,928 – $3,940 |
Bitcoin Technical Analysis
Bitcoin price has stabilized and is starting a minor recovery from the recent low of $80,630, attempting to move back towards the short-term moving average after sharp decline in mid-November. The overall trend remains bearish until key resistance is broken.
Price is below all of three main moving averages MA(5), MA(10) and MA(30), confirming a strong bearish medium-term trend. The 30-day moving average is likely to act as resistance.
The MACD line is attempting to flatten out near the bottom and may be on the verge of crossing above the signal line, hinting at a potential short-term relief rally or reversal.
MACD shows loss of bearish momentum but still deeply in negative territory.
BTCUSD is currently showing signs of a short-term bottoming bounce as indicated by the MACD momentum shift. The 30-day moving average around $95,000-$100,000 level will be the first crucial resistance test.
Bitcoin Daily Chart
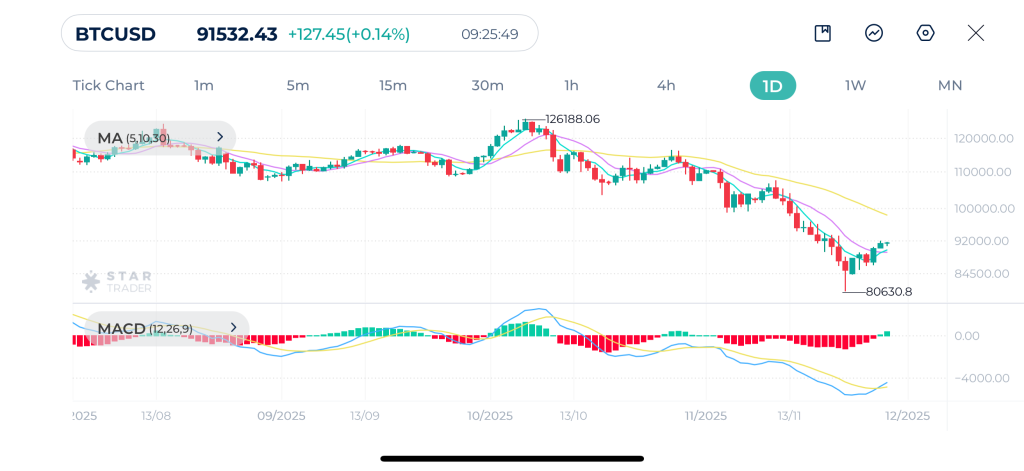
| Resistance | $94,497 – $94,535 | $96,780 – $96,800 | $98,908 – $98, 935 |
| Support | $86,141 – $86,160 | $83,547 – $83,581 | $80,640 – $80,694 |
EURUSD Technical Analysis
EURUSD is currently breaking above the 30-day moving average, which suggests a neutral to slightly bullish short-term bias within a larger consolidation zone.
The MACD line has crossed above the signal line, confirming a short-term bullish crossover and growing positive momentum.
EURUSD is in a broad consolidation phase. The recent price action and the bullish MACD crossover suggest short-term strength is returning, likely targeting the upper bound of the recent range, around the 1.1700 – 1.1800 area.
EURUSD Daily Chart
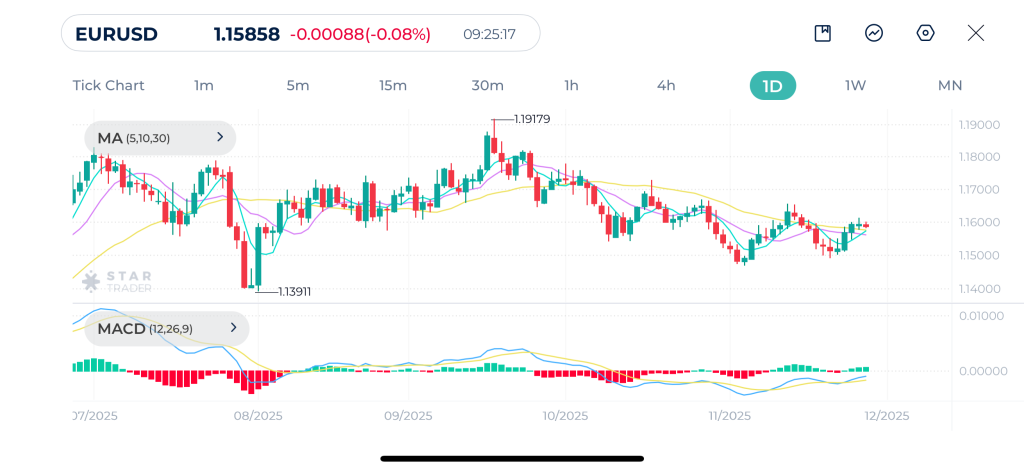
| Resistance | 1.1656 – 1.1660 | 1.1727 – 1.1730 | 1.1780 – 1.1785 |
| Support | 1.1546 – 1.1550 | 1.1491 – 1.1500 | 1.1393 – 1.1400 |
Tags


Open Live Account
 Email Address
 Phone Number
Important Notice
STARTRADER does not accept any applications from Australian residents.
To comply with regulatory requirements, clicking the button will redirect you to the STARTRADER website operated by STARTRADER PRIME GLOBAL PTY LTD (ABN 65 156 005 668), an authorized Australian Financial Services Licence holder (AFSL no. 421210) regulated by the Australian Securities and Investments Commission.
Important Notice for Residents of the United Arab Emirates
In alignment with local regulatory requirements, individuals residing in the United Arab Emirates are requested to proceed via our dedicated regional platform at startrader.ae, which is operated by STARTRADER Global Financial Consultation & Financial Analysis L.L.C.. This entity is licensed by the UAE Capital Market Authority (CMA) under License No. 20200000241, and is authorised to introduce financial services and promote financial products in the UAE.
Please click the "Continue" button below to be redirected.


