








 Web Trader MT5








Key Takeaways
- Fed resumes rate hikes: The Fed raised rates by 25 bps to 3.75%–4.00%, with Kevin Warsh signaling that inflation remains a concern and another hike could come this year.
- Gold faces mixed signals: Higher rates and Treasury yields pressured gold, while geopolitical tensions and a pullback in yields provided support for a recovery toward $4,350.
- Dollar remains sensitive to Fed policy: The hawkish Fed outlook supported the DXY, although the dollar’s gains were limited as markets assessed how much tightening is already priced in.
- BoJ raises rates: The Bank of Japan lifted rates to 1.25%, keeping monetary-policy divergence and USDJPY in focus as investors reassess the outlook for further tightening.
- Oil remains a key inflation risk: Brent and WTI stayed above $100, with Middle East supply disruptions keeping inflation risks elevated and potentially limiting central banks’ ability to ease policy.
- Crypto faces a double headwind: Bitcoin and the broader crypto market declined as the Senate blocked the CLARITY Act, while higher interest rates reduced risk appetite and increased pressure on digital assets.
Fed Resumes Rate Hikes as Global Central Banks Turn More Hawkish
The Federal Reserve raised its policy rate by 25 basis points to 3.75%–4.00%, marking its first rate increase since 2023. The decision was widely anticipated, but the accompanying message was more important for markets. The updated projections indicated that most Fed officials still see another rate increase in 2026, reinforcing expectations that monetary policy could remain restrictive for longer.
During his press conference, Fed Chair Kevin Warsh emphasized that the decision reflected a combination of a resilient US economy, insufficient improvement in inflation and the impact of geopolitical developments. The message was effectively that the Fed remains focused on containing inflation even as higher energy prices threaten to slow economic activity.
The hawkish tone initially pushed Treasury yields and the US dollar higher, while weighing on equities and gold. However, the reaction reversed the following day as oil prices eased and Treasury yields pulled back.
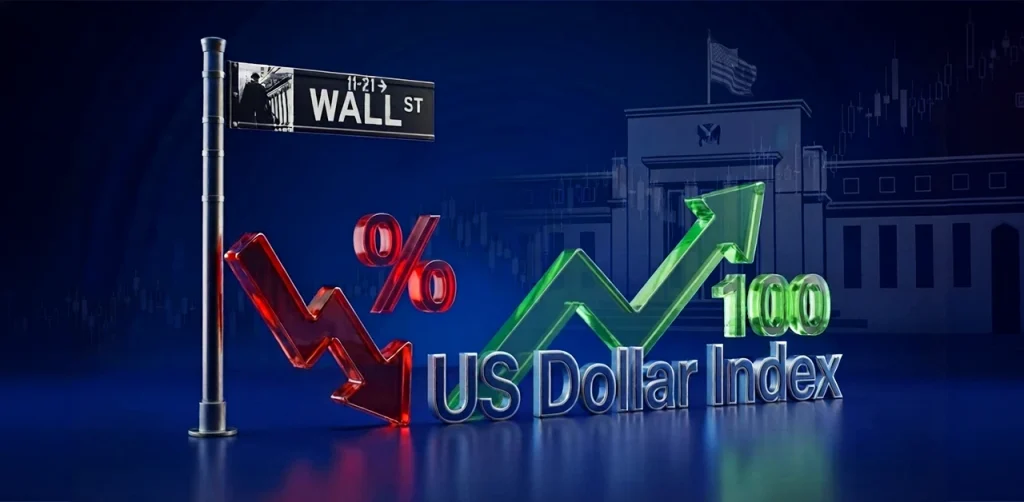
Gold Remains Resilient, The Dollar Index Rises Above 100
Gold remained under pressure around the Fed decision as higher rates and elevated Treasury yields increased the opportunity cost of holding the non-yielding metal. However, the decline was limited by geopolitical risks and a subsequent pullback in yields. The DXY initially strengthened, reaching around 99.6 earlier in the week as rising oil prices and expectations of a Fed hike supported the dollar.
Bank of Japan Raises Rates to 1.25%
The Bank of Japan followed the global tightening trend on Friday, raising its policy rate by 25 basis points from 1.00% to 1.25%, the highest level in roughly three decades. The move was widely expected and reflected persistent inflation pressures, including the impact of higher energy prices.
Interestingly, the yen weakened after the decision despite the hike. Markets focused on the presence of two dovish dissenters and the lack of an explicitly aggressive signal regarding future increases. Nevertheless, the BoJ maintained that rates could continue rising if economic activity and inflation evolve in line with its forecasts.
The combination of a hawkish Fed and a tightening BoJ will keep USDJPY particularly sensitive, with the direction of US Treasury yields and expectations for additional Japanese hikes likely to remain key drivers.
Oil Still Above $100 Despite Easing Supply Concerns
Oil remained one of the biggest drivers of global markets. Brent and WTI stayed above $100 per barrel as the conflict in the Middle East continued to threaten regional energy infrastructure and shipping routes.
However, prices eased toward the end of the week after Saudi Arabia took measures to provide additional crude to Asian refiners, helping cushion the impact of the disruption to its East-West pipeline.
The key market concern remains the same: oil above $100 can feed directly into inflation expectations, potentially forcing central banks to maintain tighter monetary policy for longer. This creates a challenging environment for equities and bonds.
CLARITY Act Setback Adds Pressure to the Crypto Market
The cryptocurrency market suffered a significant setback after the US Senate failed to advance the CLARITY Act, which was designed to establish a comprehensive regulatory framework for digital assets.
The procedural vote received 50 votes in favor and 49 against, falling short of the 60 votes required. The bill’s failure effectively puts major crypto legislation on hold, potentially until after the US midterm elections and into 2027.
The market reacted negatively. Bitcoin briefly fell toward $75,000, while XRP dropped almost 10%, Ethereum declined around 5%, and crypto-related equities such as Coinbase and Circle suffered significantly larger losses.
The regulatory setback came at the same time as the Fed’s hawkish policy shift, creating a double headwind for crypto: less regulatory clarity and higher interest rates.
Major Economic Calendar Events for the Upcoming Week
| Date | Metric | Country | Previous | Time [Dubai] |
| Tuesday, 22 September | RBA Gov Bullock Speaks | Australia | 7:10 AM | |
| Wednesday, 23 September | Flash Manufacturing PMI | USA | 53.9 | 5:45 PM |
| Wednesday, 23 September | Flash Services PMI | USA | 56.5 | 5:45 PM |
| Thursday, 24 September | Employment Change | Australia | -15.8K | 5:30 AM |
| Thursday, 24 September | Unemployment Rate | Australia | 4.5% | 5:30 AM |
| Thursday, 24 September | Interest Rate Decision | Switzerland | 0.00% | 11:30 AM |
| Thursday, 24 September | Unemployment Claims | USA | 196K | 4:30 PM |
| Thursday, 24 September | New Home Sales | USA | 607K | 6:00 PM |
| Friday, 25 September | Durable Goods Orders | USA | 1.1% | 4:30 PM |
Technical Analysis and Forecast:
Gold Technical Analysis
Gold is showing strong bullish momentum, trading around $4,393 after rebounding from the recent low near $4,100–$4,150 and recovering sharply from the latest pullback..
The key resistance is $4,400–$4,422, followed by $4,527 and the recent high of $4,696. A sustained break above $4,422 would strengthen the bullish recovery. Initial support is around $4,342, followed by $4,318 and $4,264. Overall, the short-term momentum is bullish, with $4,400–$4,422 being the key area to watch.
Gold Daily Chart
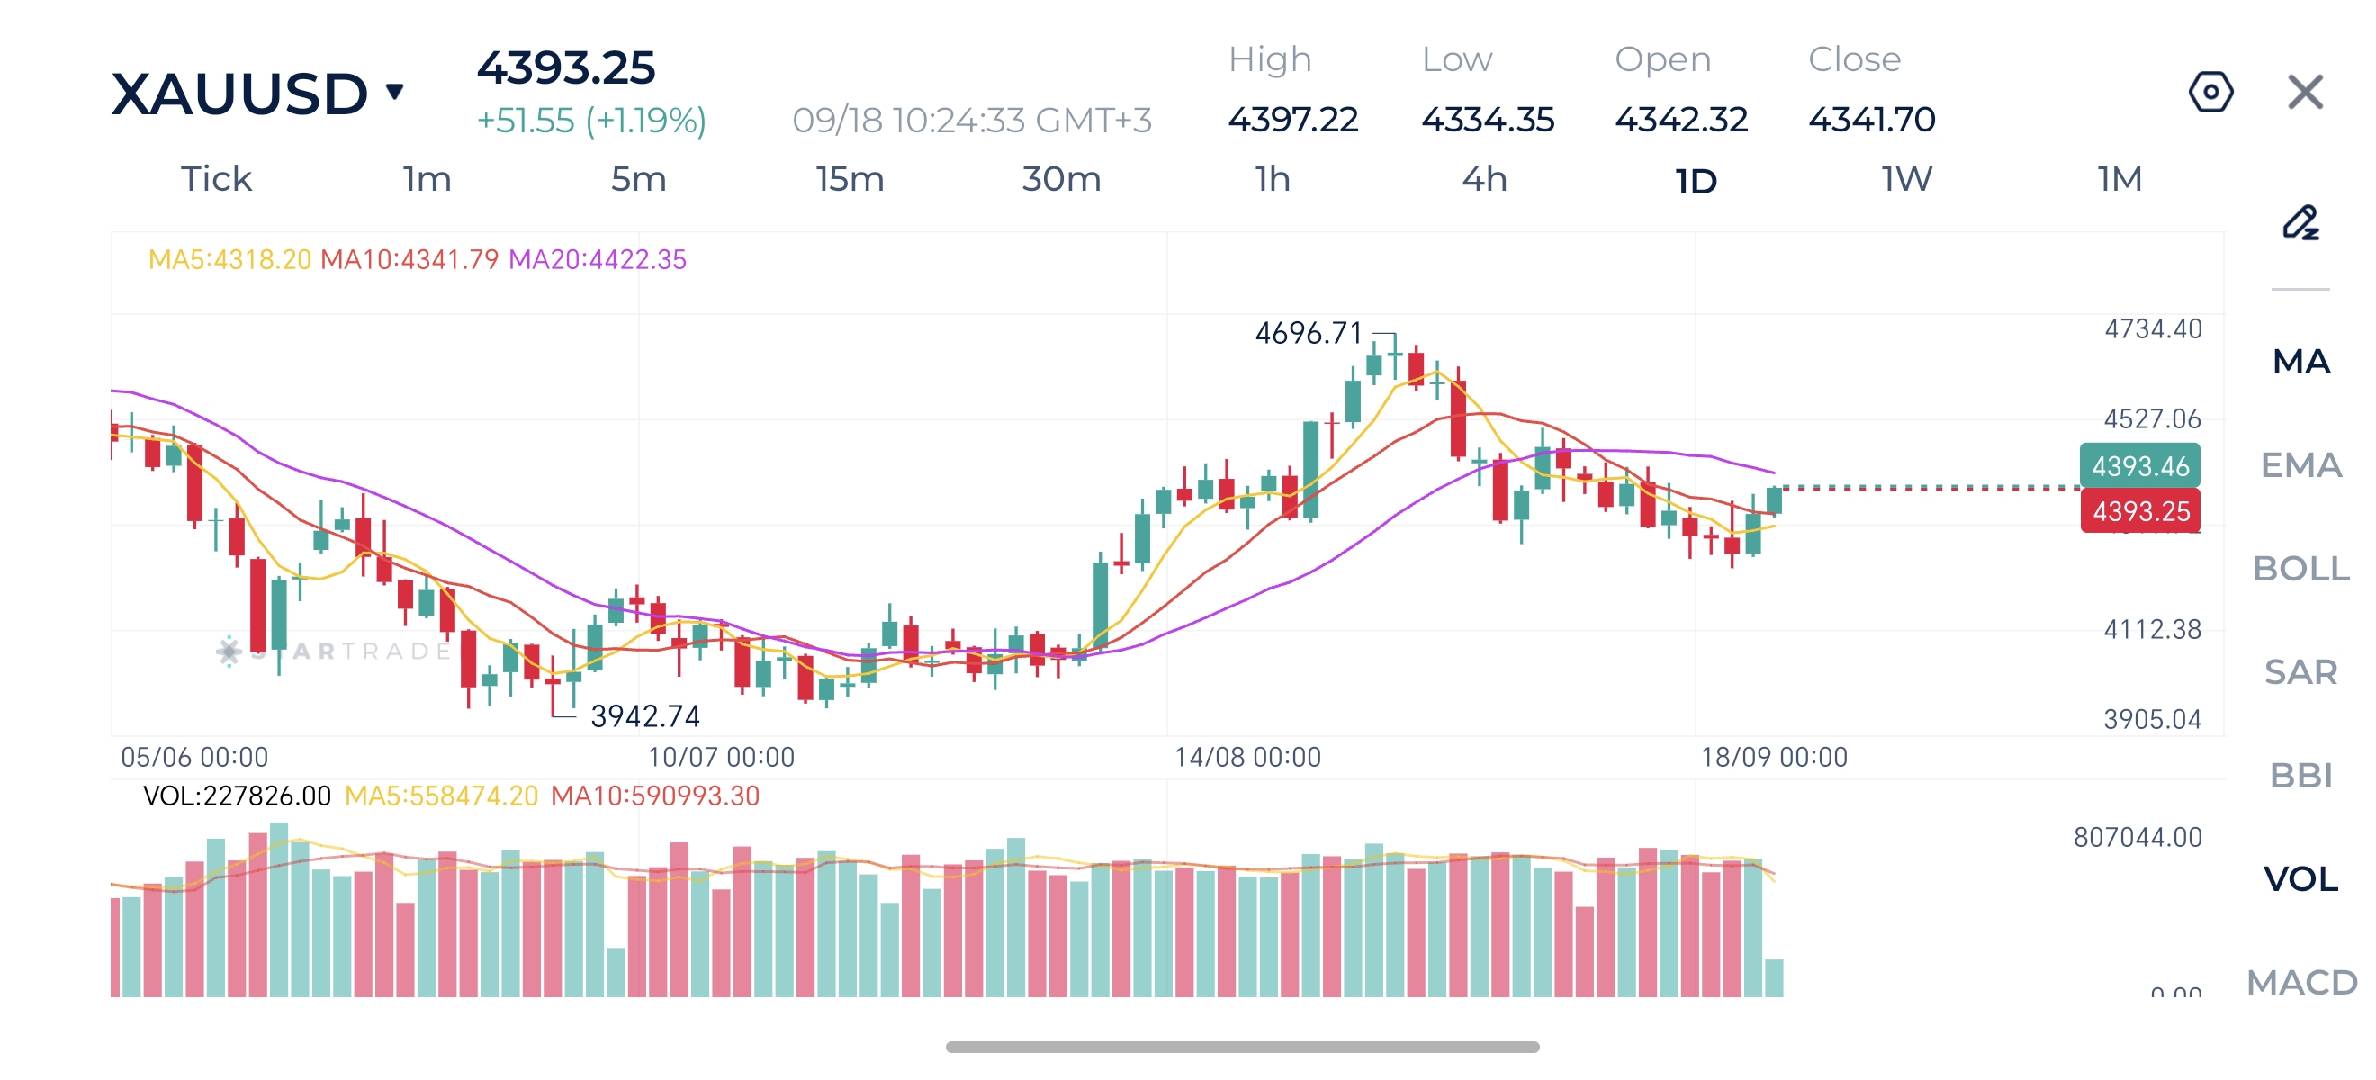
Source: STARTRADER app | Gold remains resilient around $4,400 despite higher yields
| Resistance | $4,422 – $4,440 | $4,527 – $4,540 | $4,688 – $4,700 |
| Support | $4,325 – $4,340 | $4,207 – $4,226 | $4,147 – $4,160 |
Brent Technical Analysis
Brent crude has turned bearish in the short term, falling sharply to around $102.57 after reaching a recent high of $110.42. The latest decline has pushed price below the MA5 at $105.86, although it remains above the MA10 at $104.55 and well above the MA20 at $98.65. This indicates a short-term correction within a broader rising structure.
The immediate support is around $102.50, followed by $100–$98.65. A break below $98.65 would represent a more significant deterioration in the trend. On the upside, $104.55–$105.86 is the first resistance zone, followed by $108 and the recent high at $110.42. For now, momentum is bearish, but the medium-term structure remains supported above the MA20.
Brent Daily Chart
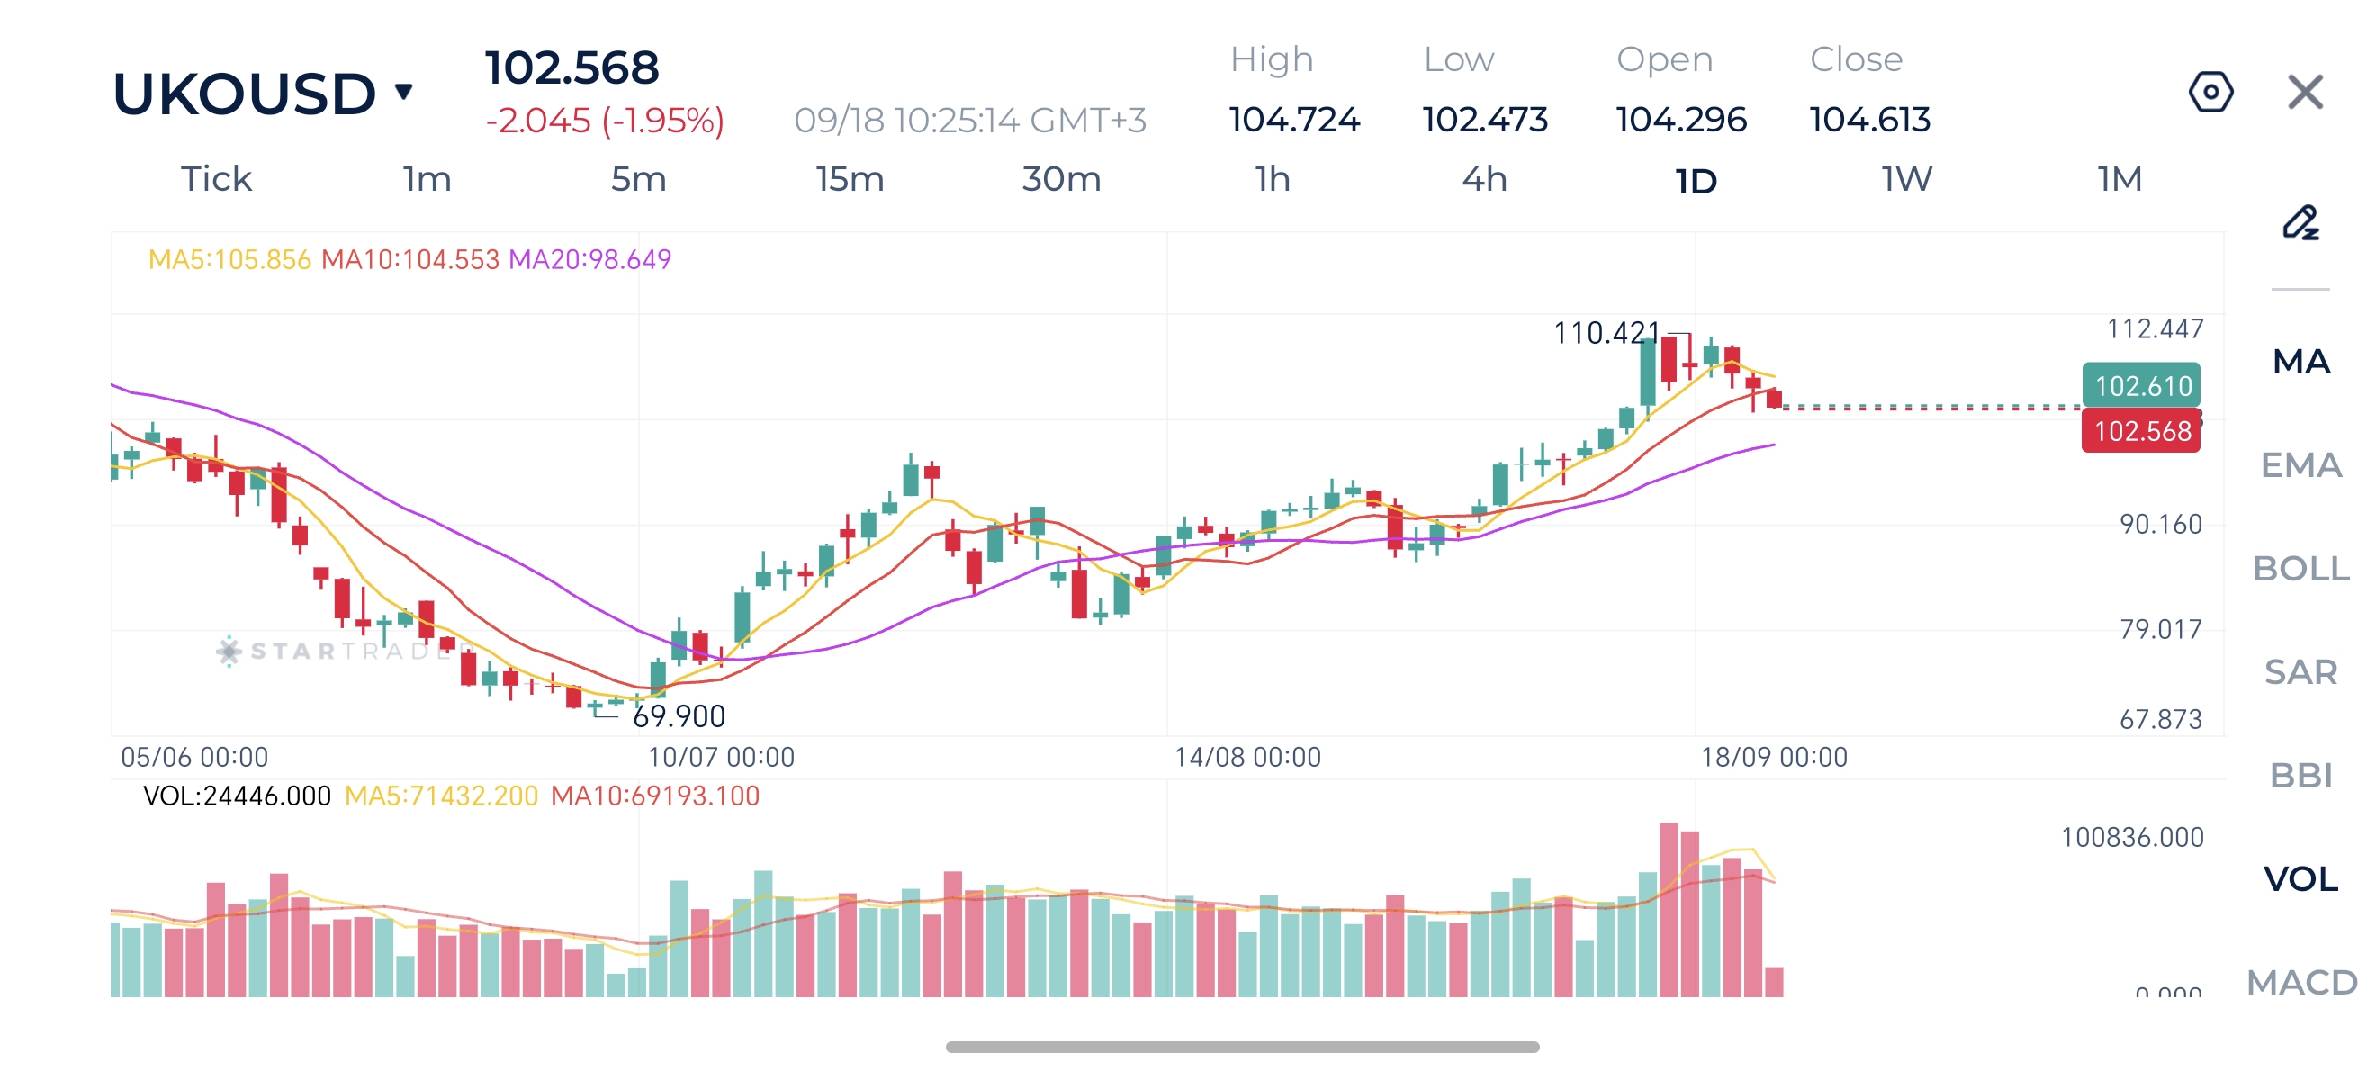
Source: STARTRADER app | Crude brent faces resistance at the $100 level
| Resistance | $104.55 – $104.65 | $105.86 – $105.80 | $106.73 – $106.90 |
| Support | $102.50 – $102.56 | $100.34 – $100.50 | $98.65 – $98.80 |
S&P 500 Technical Analysis
The S&P 500 is showing a mild bullish recovery, trading around 7,676 after rebounding from the recent decline toward 7,531. The recent price action suggests improving short-term momentum, although the index remains below its recent peak of 7,825
Immediate resistance is around 7,700–7,725, followed by the recent high at 7,825. On the downside, 7,670 is the first support, followed by 7,623–7,643 and then 7,531. A sustained break above 7,700 would strengthen the recovery, while a move back below 7,623 would weaken the short-term structure.
S&P 500 Daily Chart
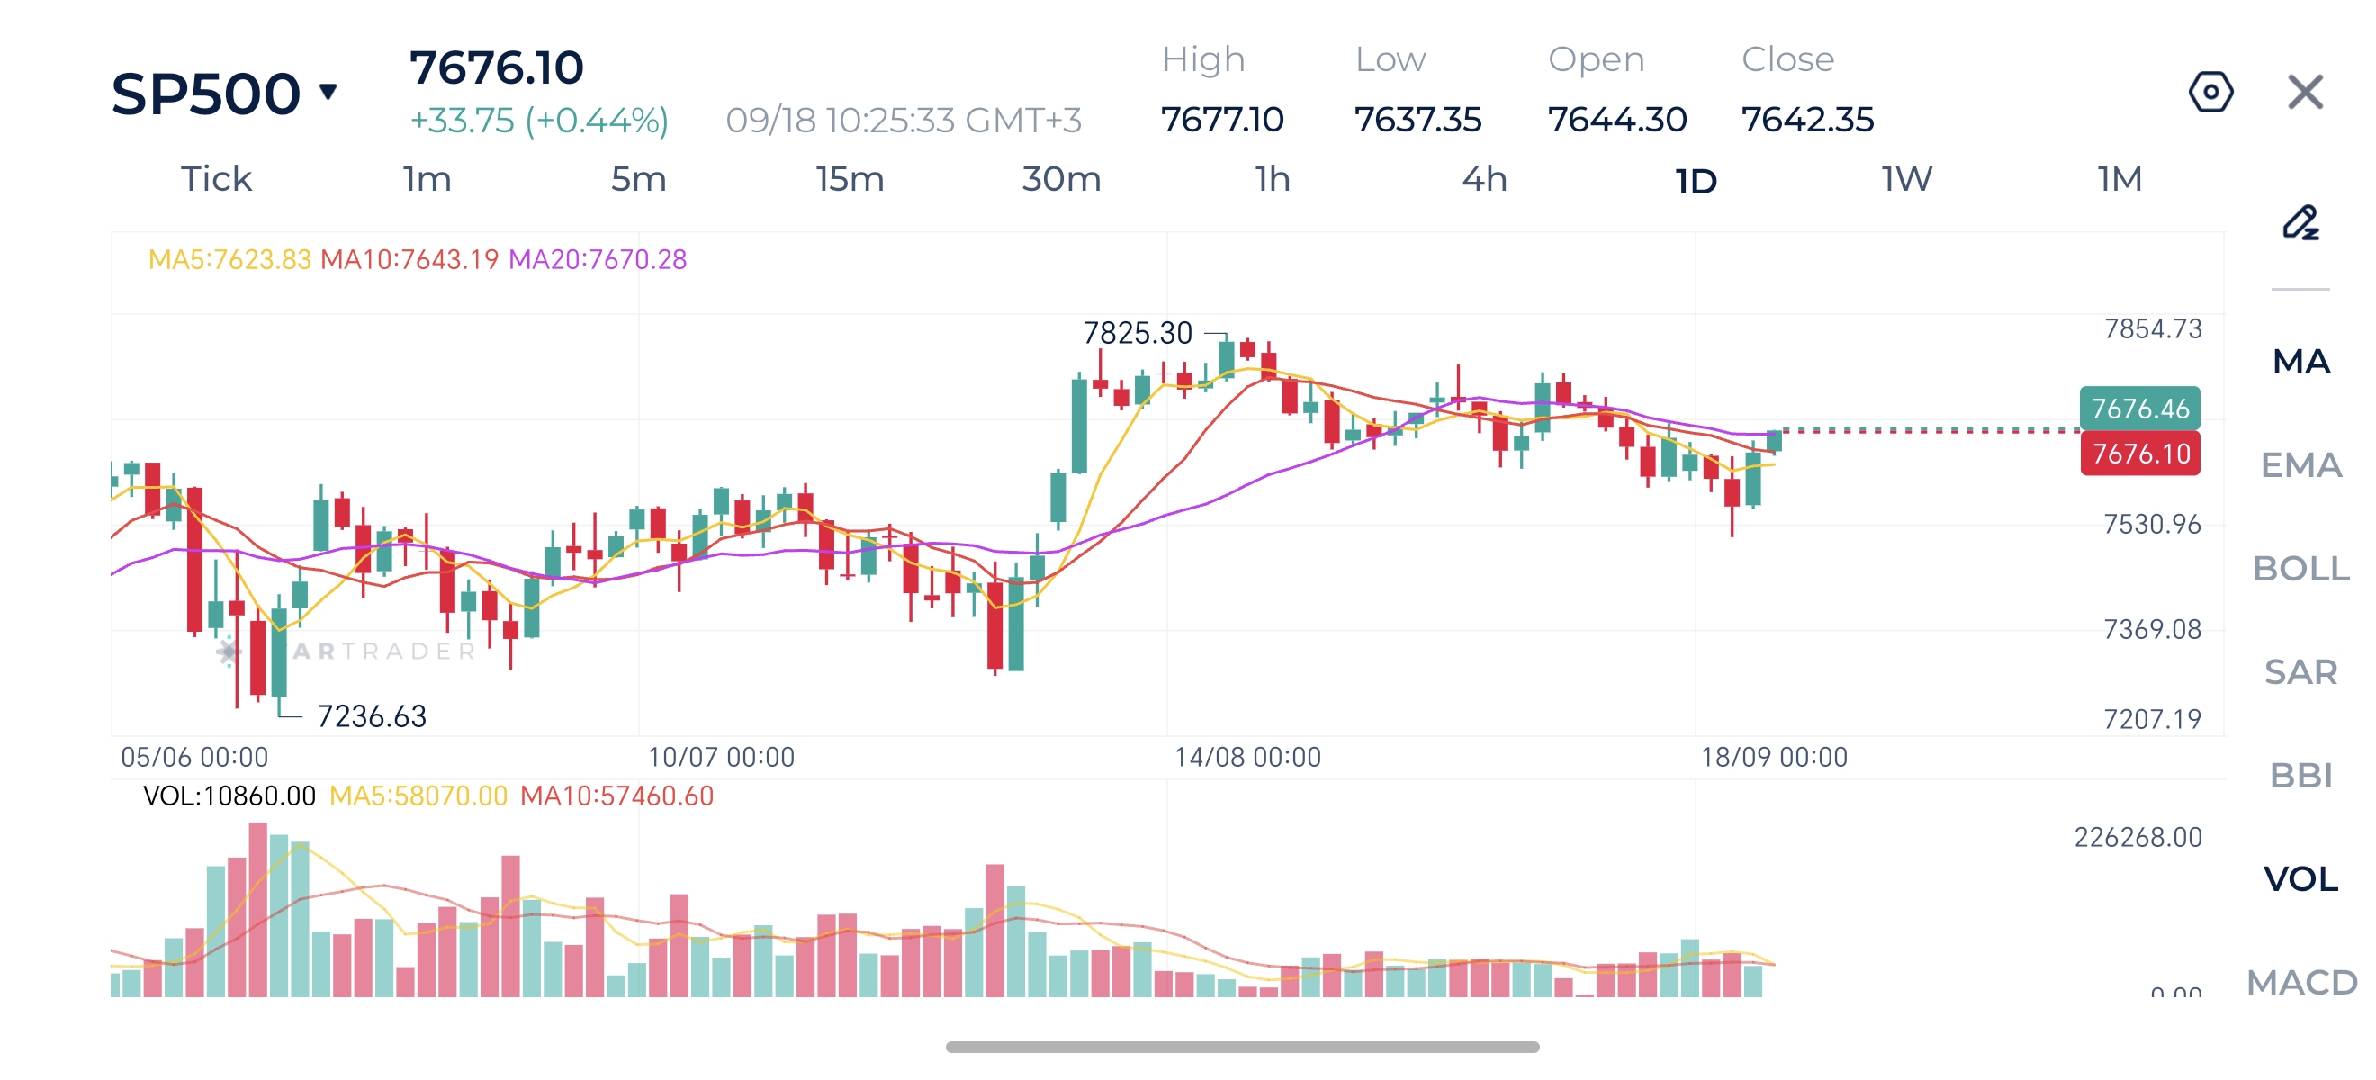
Source: STARTRADER app | S&P 500 remains strong despite tighter monetary policy from the Fed
| Resistance | 7,727 – 7,740 | 7,815 – 7,820 | 7,890 – 7,900 |
| Support | 7,576 – 7,580 | 7,466 – 7,480 | 7,335 – 7,340 |
USDJPY Technical Analysis
USDJPY is showing a strong short-term bullish rebound, trading around 157.20 after recovering sharply from the 152.88 area. The recent higher lows indicate improving upside momentum.
Immediate resistance is around 157.20–157.50, followed by 158.40 and the previous major resistance zone around 161.50. Support is at 156.80, followed by 155.75–154.85. A sustained break above 157.50 could extend the recovery, while a drop below 156.80 would suggest that the rebound is losing momentum.
USDJPY Daily Chart
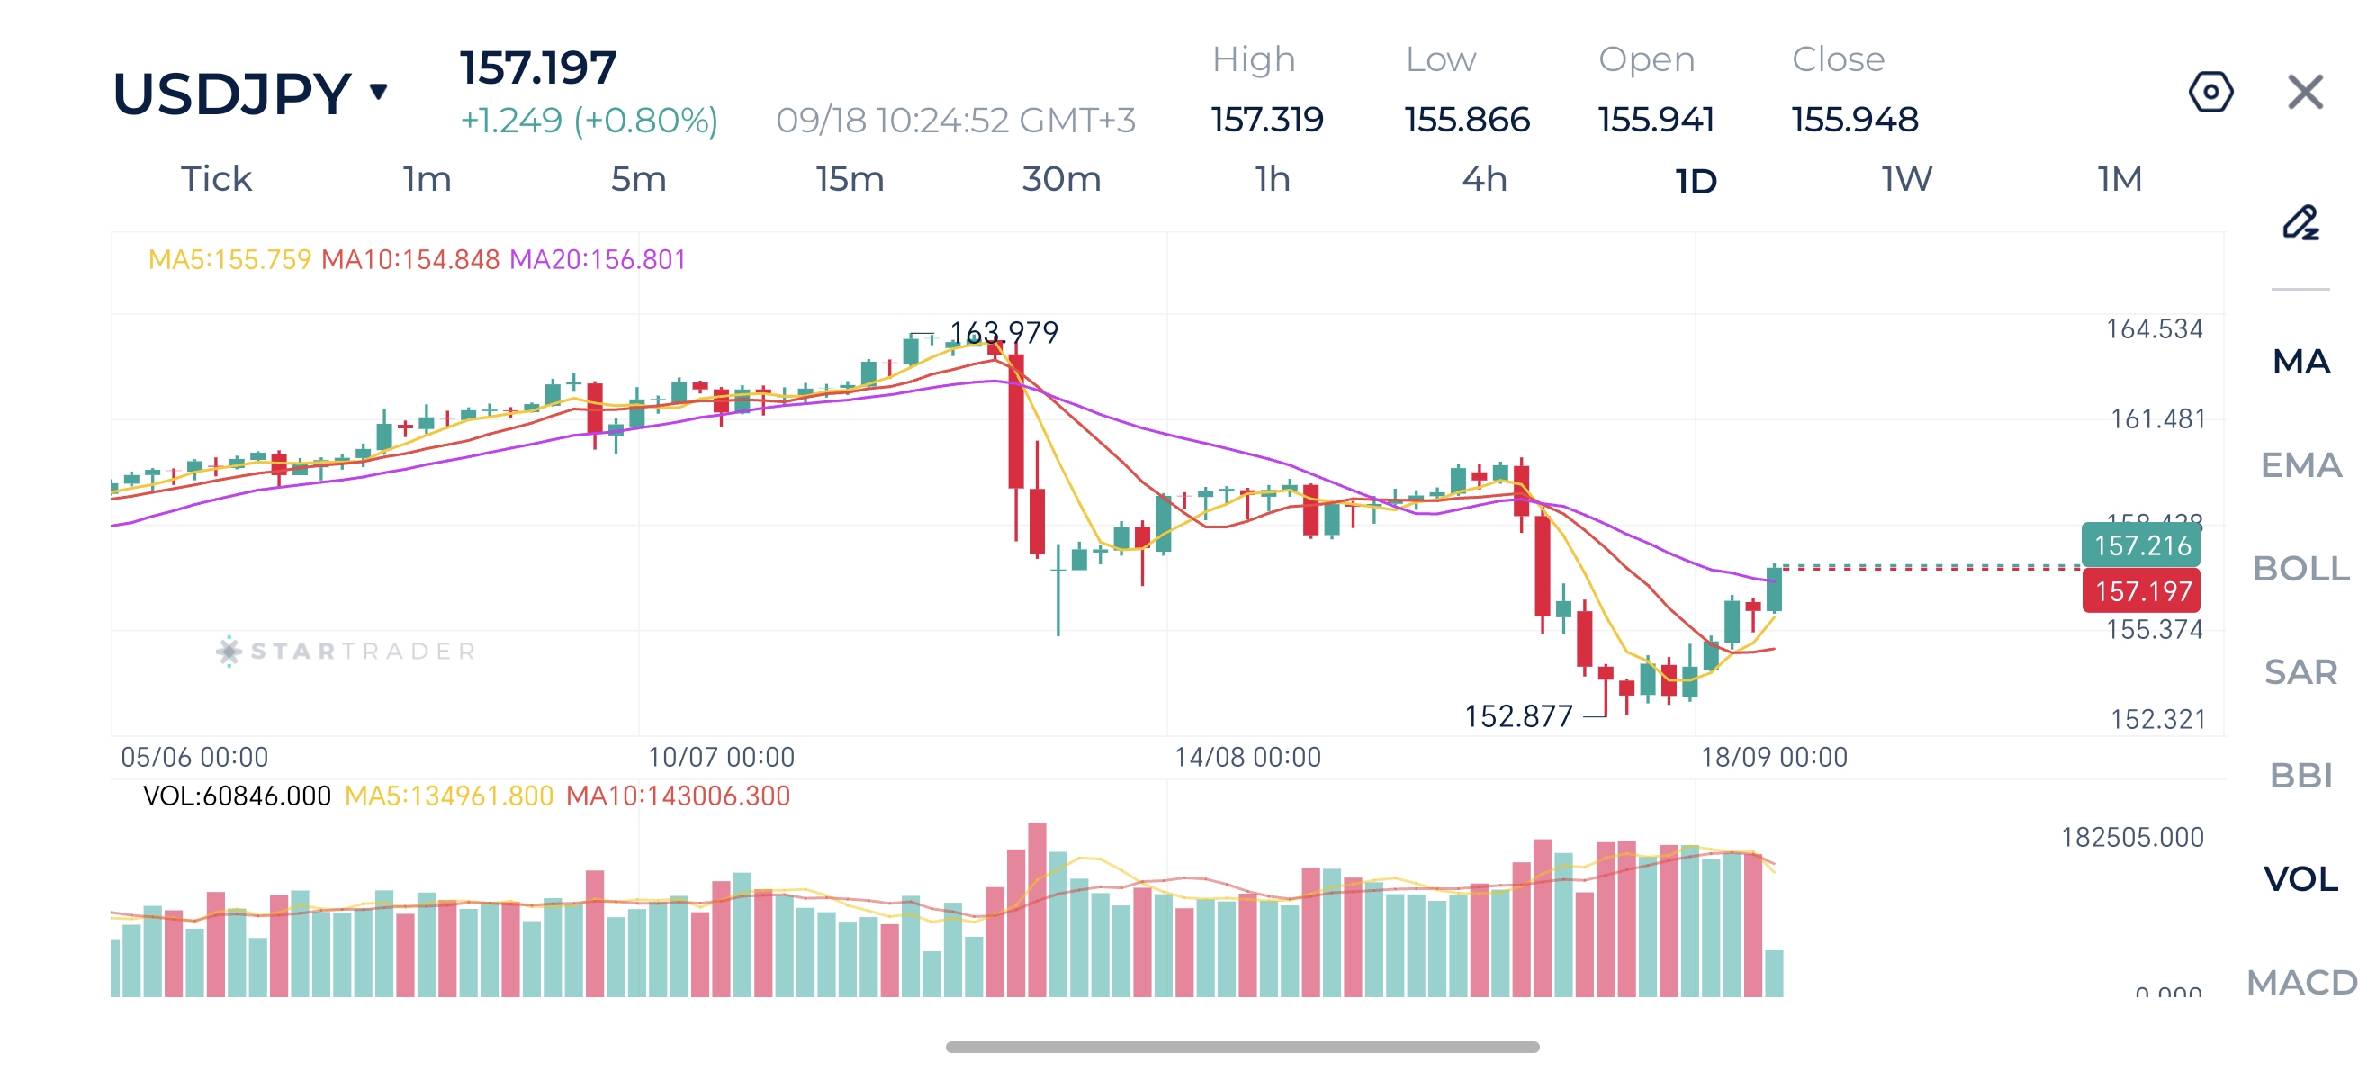
Source: STARTRADER app | USDJPY rises 2.5% despite a rate hike from Bank of Japan
| Resistance | 157.50 – 157.54 | 158.40 – 158.45 | 159.20 – 159.25 |
| Support | 156.70 – 156.75 | 155.30 – 155.35 | 154.20 – 154.25 |
Listen on Spotify
Risk Disclaimer: This material is provided for informational purposes only and does not constitute a recommendation or investment advice. Trading financial instruments on margin involves substantial risk and may not be appropriate for all investors.
Tags


Open Live Account
 Email Address
 Phone Number
Important Notice
STARTRADER does not accept any applications from Australian residents.
To comply with regulatory requirements, clicking the button will redirect you to the STARTRADER website operated by STARTRADER PRIME GLOBAL PTY LTD (ABN 65 156 005 668), an authorized Australian Financial Services Licence holder (AFSL no. 421210) regulated by the Australian Securities and Investments Commission.
Important Notice for Residents of the United Arab Emirates
In alignment with local regulatory requirements, individuals residing in the United Arab Emirates are requested to proceed via our dedicated regional platform at startrader.ae, which is operated by STARTRADER Global Financial Consultation & Financial Analysis L.L.C.. This entity is licensed by the UAE Capital Market Authority (CMA) under License No. 20200000241, and is authorised to introduce financial services and promote financial products in the UAE.
Please click the "Continue" button below to be redirected.


