


Key Takeaways
- The Federal Reserve delivered a 25 bps rate cut, marking the third consecutive reduction this year.
- U.S. stocks hit fresh record highs, with the S&P 500 leading gains and Dow Jones breaking 48,800
- Tech underperformed as weak earnings from Oracle reignited concerns about stretched AI valuations, weighing on the Nasdaq.
- The U.S. dollar posted a third weekly decline, pressured by rising expectations that the Fed will continue cutting rates next year.
- Gold and silver remained strong, supported by dollar weakness with gold holding near historically high levels and silver pushing to new records.
- Crypto markets turned volatile, with Bitcoin, Ethereum, and XRP initially rallying after the Fed cut, then retreating slightly.
Fed Cut and Mixed Market Reactions
The week was dominated by US monetary policy as the Federal Reserve delivered a widely expected interest rate cut of 25 basis points, lowering the federal funds rate and reinforcing expectations that the cycle of rate easing has begun. This marked the third consecutive Fed rate reduction and helped shape risk sentiment across global markets.
Equity markets reacted in a mixed but broadly positive fashion. The S&P 500 hit record highs as consumer, financial, and industrial stocks rallied on the dovish Fed stance, even as disappointing tech earnings and AI-sector jitters weighed on parts of the Nasdaq. Dow Jones also surged to new record levels above 48,800.
The U.S. dollar eased for the third straight week, continuing its decline as markets priced in an increased likelihood of multiple rate cuts beyond 2025 and lower real yields. Major currencies such as the euro and British pound also benefited from broad dollar weakness.
Silver Surged to a New Record High Above $64.00
Precious metals continued to benefit from the Fed’s rate cut and dovish outlook. While some early sessions showed modest consolidation as markets awaited the decision, gold remained supported near elevated levels thanks largely to a softer dollar.
Gold futures traded above the $4,200 level amid strong rate-cut expectations, with many traders pricing in a more accommodative Fed trajectory into 2026. Lower real yields and heightened safe-haven demand kept bullion firm even when other risk assets fluctuated.
Silver’s momentum also remained very strong, with prices reaching record levels above $64 per ounce, doubling since April of this year.
Across the board, gold and silver continued to attract interest not just as inflation hedges but also as alternative stores of value amid lingering global economic uncertainties.
Crypto Market Slowly Recovers with Modest Gains
The crypto market experienced heightened volatility around the Fed decision. After an initial spike in major digital assets like Bitcoin above key levels, markets quickly retraced gains as the Fed’s cautious tone implied only limited future easing.
Bitcoin fell back from early optimism, slipping over 2% shortly after the rate cut announcement, while Ethereum and XRP also retreated, underscoring how crypto sentiment can flip quickly when macro catalysts shift.
Looking ahead, crypto markets appear poised for continued sensitivity to macro developments, particularly Fed messaging and macroeconomic data releases that may reshape liquidity expectations.
With the Fed’s policy decision now behind markets, investors will turn attention to fresh U.S. economic data, corporate earnings, and year-end flows. Continued rate-cut pricing and evolving macro indicators—including labor and inflation trends will be central to markets’ directional bias in the lead-up to 2026.
Key Economic Data of the week
- Reverve Bank of Australia kept interest rates unchanged at 3.60% in line with market expectations.
- ADP Weekly Employment numbers in the US improved as it showed an increase of 4.8K jobs on average.
- JOLTS Job Openings rose to 7.76m in October, up from 7.14m in the month of September.
- Bank of Canada maintains its interest rate unchanged at 2.25%.
- The Federal Reserve delivers a third rate cut of 25bps and restarts treasury bill purchases.
- The Australian unemployment rate holds steady at 4.3%, lower than expected.
- Swiss National Bank kept its policy rate unchanged at 0.00%
Major Economic Calendar Events for the Upcoming Week
| Date | Metric | Country | Previous | Time [Dubai] |
| Monday, 15 December | Consumer Price Index | Canada | 2.70% | 5:30 PM |
| Tuesday, 16 December | Flash Manufacturing PMI | Euro | 49.6 | 1:00 PM |
| Tuesday, 16 December | Flash Services PMI | Euro | 53.6 | 1:00 PM |
| Tuesday, 16 December | Flash Manufacturing PMI | UK | 50.2 | 1:30 PM |
| Tuesday, 16 December | Flash Services PMI | UK | 51.3 | 1:30 PM |
| Tuesday, 16 December | Non-Farm Employment Change | USA | 119K | 5:30 PM |
| Tuesday, 16 December | Unemployment Rate | USA | 4.40% | 5:30 PM |
| Tuesday, 16 December | Flash Manufacturing PMI | USA | 52.2 | 6:45 PM |
| Tuesday, 16 December | Flash Services PMI | USA | 54.1 | 6:45 PM |
| Wednesday, 17 December | Consumer Price Index y/y | UK | 11:00 AM | |
| Thursday, 18 December | Interest Rate Decision | UK | 4.00% | 4:00 PM |
| Thursday, 18 December | Interest Rate Decision | Euro | 2.15% | 5:15 PM |
| Thursday, 18 December | Consumer Price Index | USA | 3.00% | 5:30 PM |
| Friday, 19 December | Interest Rate Decision | Japan | Tentative | |
| Friday, 19 December | Core PCE Price Index m/m | USA | Tentative |
Technical Analysis and Forecast:
Silver Technical Analysis and Forecast
Silver remains in a powerful uptrend, making fresh highs and pushing above the $64. The price structure is extremely bullish, with all three moving averages (5, 10, and 30) trending upward and acting as strong dynamic support.
The recent sequence of higher highs and higher lows confirms that buyers are in control, and every pullback into the short-term MAs has been aggressively defended. This is classic trend-acceleration behavior, commonly seen during strong commodity rallies.
MACD confirms this strength as the MACD line remains well above the signal line.
If Silver maintains above the $62.50–$63.00 support range, the bullish scenario remains dominant. A clean breakout above $64.30 could extend the rally toward the next psychological resistance zones at $65.00 and $66.40. On the other hand, a drop below the 30-day moving average would signal a deeper correction.
Silver Daily Chart
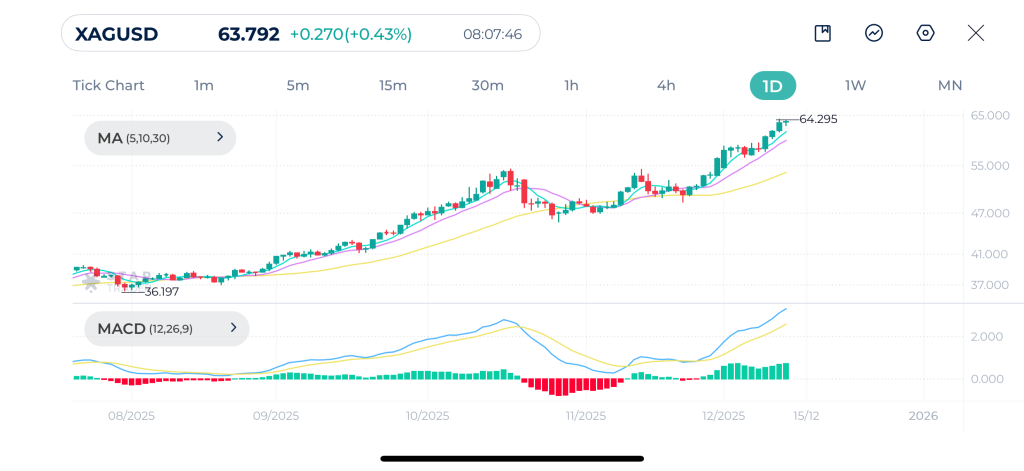
| Resistance | $64.24 – $64.30 | $64.50 – $64.55 | $64.86 – $65.00 |
| Support | $62.05 – $62.10 | $60.83 – $61.00 | $59.40 – $59.52 |
Dow Jones Technical Analysis and Forecast
Dow Jones continues its strong uptrend, pushing toward the 49,000 level with clear bullish structure. Price action remains consistently above the 5-day, 10-day, and 30-day moving averages, all of which are sloping upward. This alignment of these moving averages reflects a market where buyers remain firmly in control.
Momentum is also strengthening, indicating increasing bullish pressure as the MACD line widens above the signal line. However, price is approaching a psychological round number near 49,000, which could slow momentum and trigger short-term consolidation.
Overall, the technical picture remains strongly bullish. As long as price holds above 48,300–48,400, the trend remains upward. A clean daily close above 49,000 may open the door to a continuation toward 49,400 and potentially 50,000 over the coming sessions.
Dow Jones Daily Chart
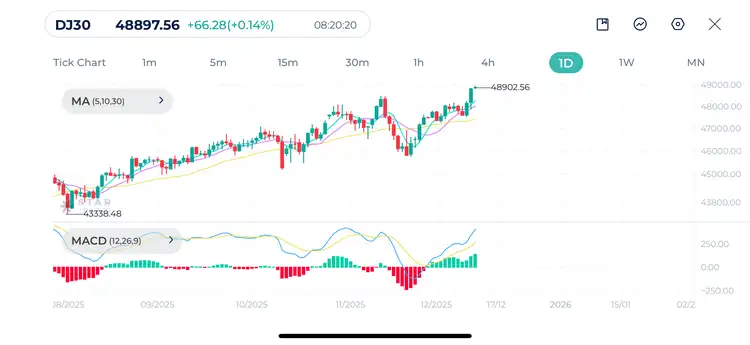
| Resistance | 49,000 – 49,050 | 49,100 – 49,161 | 46,200 – 46,226 |
| Support | 47,983 – 48,128 | 47,438 – 47,521 | 46,852 – 46,905 |
Bitcoin Technical Analysis and Forecast
Bitcoin remains in a corrective phase within a broader downtrend, but the recent rebound from the $80,630 low has stabilized price above the $91,000–$92,000 zone. Despite this stabilization, the structure is still technically bearish because the price continues trading below the 30-day moving average, which is sloping downward and acting as dynamic resistance.
Momentum is showing improvement. MACD line has crossed above the signal line from a deeply oversold region, which often marks the start of a medium-term recovery. However, this signal becomes meaningful only if Bitcoin can break above the 30-day moving average and hold above it.
For now, Bitcoin is caught between conflicting signals. Price holds a rebound structure but remains below major trend resistance. A break and daily close above $95,000 would be the first strong indication that a new bullish phase is forming. Until then, $90,000 remains key support, losing it would likely expose the market to $87,000 and potentially a retest of the $80,000 zone.
Bitcoin Daily Chart
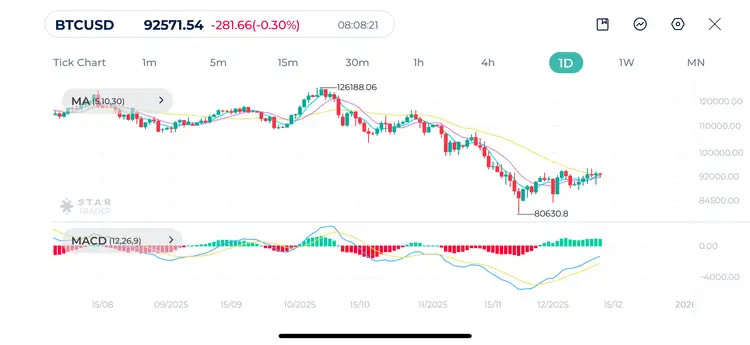
| Resistance | $96,625 – $96,730 | $99,016 – $99,120 | $101,240 – $101,300 |
| Support | $87,724 – $87,800 | $83,905 – $84,200 | $80,464 – $80,500 |
EURUSD Technical Analysis and Forecast
The daily chart of EURUSD shows a clear bullish structure. This bullish momentum is confirmed by the slope of moving averages MA(5) and MA(10).
MACD shows a definitive bullish crossover, with the MACD line rising above the signal line, indicating accelerating positive momentum. Key resistance lies at the previous local high around 1.1800, with the major target being the 1.1917 previous peak.
Upcoming resistance levels 1.1770 and 1.1800 are crucial. Breaking above these levels can open the door for another leg up towards 1.1850 and 1.1900
EURUSD Daily Chart
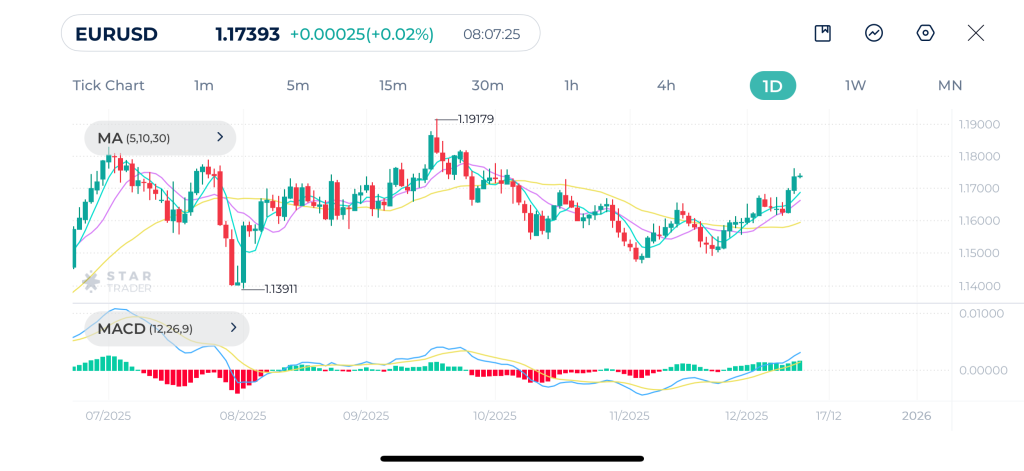
| Resistance | 1.1782 – 1.1800 | 1.1819 – 1.1831 | 1.1887 – 1.1900 |
| Support | 1.1680 – 1.1691 | 1.1610 – 1.1616 | 1.1555 – 1.1571 |
Tags
Open Live Account
Please enter a valid country
No results found
No results found
Please enter a valid email
Please enter a valid verification code
1. 8-16 characters + numbers (0-9) 2. blend of letters (A-Z, a-z) 3. special characters (e.g, !a#S%^&)
Please enter the correct format
Please tick the checkbox to proceed
Please tick the checkbox to proceed
Important Notice
STARTRADER does not accept any applications from Australian residents.
To comply with regulatory requirements, clicking the button will redirect you to the STARTRADER website operated by STARTRADER PRIME GLOBAL PTY LTD (ABN 65 156 005 668), an authorized Australian Financial Services Licence holder (AFSL no. 421210) regulated by the Australian Securities and Investments Commission.
CONTINUEImportant Notice for Residents of the United Arab Emirates
In alignment with local regulatory requirements, individuals residing in the United Arab Emirates are requested to proceed via our dedicated regional platform at startrader.ae, which is operated by STARTRADER Global Financial Consultation & Financial Analysis L.L.C.. This entity is licensed by the UAE Capital Market Authority (CMA) under License No. 20200000241, and is authorised to introduce financial services and promote financial products in the UAE.
Please click the "Continue" button below to be redirected.
CONTINUEError! Please try again.

