








 Web Trader MT5









Key Takeaways
- U.S. equities lost momentum as rising oil prices and geopolitical uncertainty outweighed positive corporate earnings.
- The FOMC minutes reinforced a cautious Federal Reserve, showing policymakers remain divided on interest rates.
- The U.S. dollar weakened overall, as softer labor market expectations offset the Fed’s relatively hawkish stance.
- Oil prices surged on supply disruption fears, reviving inflation concerns and reducing expectations that the Federal Reserve will ease monetary policy anytime soon.
- Gold remained resilient despite volatility, recovering above $4,100 as the weaker U.S. dollar provided support.
U.S. Stock Market
U.S. equities finished the week on a cautious note. The Dow Jones, S&P 500, and Nasdaq all faced pressure as rising oil prices revived inflation concerns and reduced expectations for near-term Federal Reserve rate cuts. Although technology stocks found intermittent support from semiconductor shares, overall market sentiment weakened as geopolitical risks intensified.
Economic data also painted a mixed picture. The ISM Services PMI remained in expansionary territory, indicating that the U.S. services sector continues to grow. However, the report did little to change investors’ outlook, as markets remained far more focused on inflation risks and the Federal Reserve’s next policy move.
The release of the FOMC Minutes was one of the week’s most closely watched events. The minutes revealed that policymakers remain divided on the future path of interest rates. While some members believe rates may eventually move lower, officials also expressed continued concern that inflation remains above target and acknowledged that further policy tightening could still be necessary if price pressures persist. Overall, the minutes reinforced the view that the Federal Reserve is likely to remain data-dependent and cautious rather than rushing into policy easing.
Forex Market
The U.S. dollar weakened against most major currencies during the week despite persistent geopolitical uncertainty. The primary driver behind the softer dollar was growing market expectations that the Federal Reserve may delay additional rate hikes following weaker U.S. employment data released at the end of the previous week. Although the FOMC minutes maintained a relatively hawkish tone, they failed to provide a strong catalyst for renewed dollar buying.
The New Zealand dollar outperformed after the Reserve Bank of New Zealand raised its official cash rate by 25 basis points to 2.50%, signaling confidence in the country’s economic recovery while remaining focused on inflation.
Meanwhile, the Japanese yen received support after Japan’s Finance Minister Katayama stated that gradual interest rate increases are expected as the government continues to pursue an active fiscal policy. The comments reinforced expectations that the Bank of Japan will continue moving away from its ultra-loose monetary stance, helping stabilize the yen despite ongoing dollar volatility.
Commodities
Renewed military strikes between the United States and Iran dramatically increased geopolitical risk after commercial vessels in the Strait of Hormuz were attacked. The escalation effectively ended the fragile ceasefire and renewed fears of supply disruptions through one of the world’s most important oil shipping routes.
Oil prices surged sharply in response before giving back some gains later in the week as traders locked in profits. Nevertheless, crude prices remain elevated as markets continue pricing in a geopolitical risk premium.
Higher oil prices also revived inflation concerns, supporting U.S. Treasury yields and limiting expectations for Federal Reserve easing.
Gold experienced two-way volatility throughout the week. Initially, the stronger U.S. dollar and rising Treasury yields pressured prices lower. However, gold later recovered above the $4,100 level as the dollar weakened following the FOMC minutes. Despite the rebound, expectations that inflation could remain elevated and interest rates stay higher for longer may continue to limit gold’s upside in the near term.
Outlook for the Week Ahead
Looking ahead, markets are expected to remain driven by three major themes.
First, investors will continue monitoring developments between the United States and Iran. Any further escalation around the Strait of Hormuz could trigger another sharp rally in oil prices, increase safe-haven demand, and create renewed volatility across equity and commodity markets.
Second, attention will shift back to U.S. economic data as investors search for evidence on whether inflation is easing enough for the Federal Reserve to consider changing its policy outlook before the July FOMC meeting. Treasury yields and expectations for future interest rates are likely to remain key drivers of market sentiment.
Finally, the foreign exchange market will continue focusing on monetary policy divergence among major central banks. While the Federal Reserve maintains a cautious stance, policy moves from central banks such as the Reserve Bank of New Zealand and the Bank of Japan could create additional opportunities across major currency pairs.
Overall, investors should expect another week of elevated volatility, with geopolitics, inflation expectations, and central bank policy remaining the dominant forces shaping global financial markets.
Major Economic Calendar Events for the Upcoming Week
| Date | Metric | Country | Previous | Time [Dubai] |
| Monday, 13 July | FOMC Member Waller Speaks | USA | 8:30 AM | |
| Tuesday, 14 July | Consumer Price Index | USA | 4.20% | 4:30 PM |
| Tuesday, 14 July | Fed Chairman Warsh Testifies | USA | 6:00 PM | |
| Wednesday, 15 July | Producer Price Index m/m | USA | 1.10% | 4:30 PM |
| Wednesday, 15 July | Interest Rate Decision | Canada | 2.25% | 5:45 PM |
| Wednesday, 15 July | Fed Chairman Warsh Testifies | USA | 6:00 PM | |
| Thursday, 16 July | Gross Domestic Product m/m | UK | -0.10% | 10:00 AM |
| Thursday, 16 July | Retail Sales m/m | USA | 0.90% | 4:30 PM |
| Friday, 17 July | Preliminary UoM Consumer Sentiment | USA | 49.5 | 6:00 PM |
| Friday, 17 July | Preliminary UoM Inflation Expectations | USA | 4.60% | 6:00 PM |
Technical Analysis and Forecast:
Gold Technical Analysis
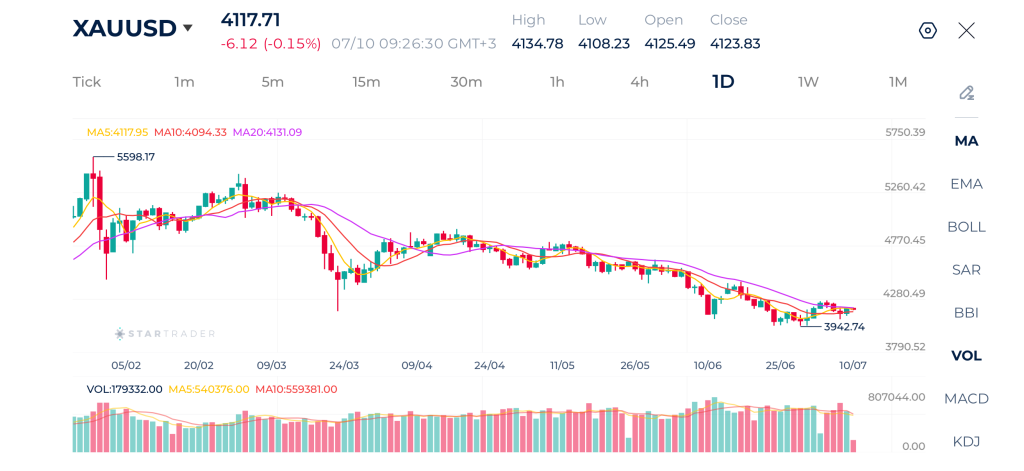
Gold continues to stabilize following its prolonged correction from the yearly high. After finding strong support around $3,942, buyers have gradually regained control, lifting price back above the 5-day and 10-day moving averages. However, the metal remains below the declining 20-day moving average, indicating that the broader trend has yet to fully transition back to bullish.
Price has established a series of higher lows since the recent bottom, indicating that buying pressure is gradually strengthening. The latest candles show consolidation around the $4,110–$4,130 area as the market attempts to build momentum for a larger recovery.
The short-term outlook has improved to neutral-to-bullish. A break above $4,135 would strengthen bullish momentum and open the way toward $4,200, followed by $4,280. Failure to hold above $4,080 could result in another test of the $4,020–$3,943 support zone.
Gold Daily Chart
| Resistance | $4,200 – $4,215 | $4,305 – $4,320 | $4,456 – $4,465 |
| Support | $4,010 – $4,022 | $3,945 – $3,960 | $3,889 – $3,900 |
Brent Technical Analysis
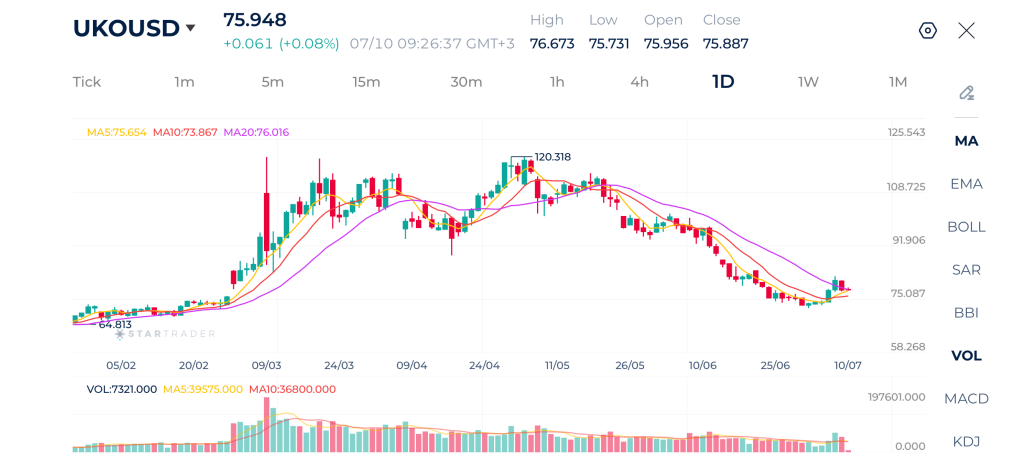
Brent crude remains in a broader bearish trend despite the recent rebound from the lows near $74.00. The market has recovered modestly over recent sessions, but price continues to trade below the downward-sloping 20-day moving average, confirming that sellers still retain the longer-term advantage.
The 5-day moving average has crossed above the 10-day MA, reflecting improving short-term momentum, although the recovery remains limited while the market stays below the 20-day average.
The recent rebound has interrupted the sequence of lower lows, suggesting bearish momentum is beginning to fade. However, buyers have yet to overcome the major resistance zone around $76.00–$76.50, leaving the current move classified as a corrective recovery within the broader downtrend.
The medium-term outlook remains neutral to bearish while Brent trades below the 20-day moving average. A sustained move above $76.70 would strengthen the recovery and expose $80.30. Conversely, rejection below resistance followed by a break under $75.00 would shift momentum back in favor of sellers and increase the likelihood of another decline toward $72.00.
Brent Daily Chart
| Resistance | $77.45 – $77.64 | $79.00 – $79.21 | $80.50 – $80.61 |
| Support | $74.20 – $74.31 | $72.87 – $73.00 | $71.33 – $71.50 |
Dow Jones Technical Analysis
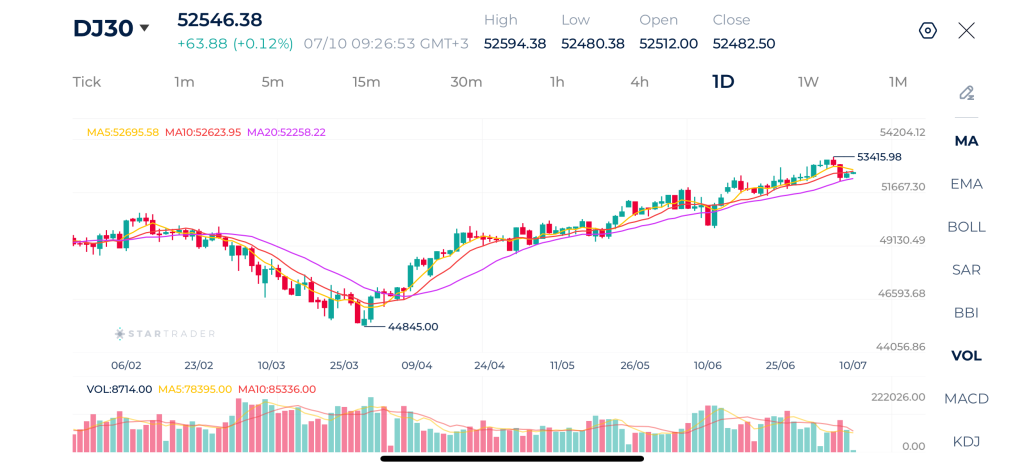
The Dow Jones remains in a strong long-term uptrend despite recent profit-taking from the record high at 53,415. Price continues to trade comfortably above the rising 20-day moving average, while the moving averages maintain a bullish alignment, confirming that buyers remain in control over the broader trend.
The recent pullback has slightly weakened short-term momentum but has not damaged the overall bullish market structure.
Following the rejection from the recent high, the index has entered a period of consolidation. The latest candles show relatively small real bodies, indicating indecision between buyers and sellers after the recent rally. Importantly, the correction has remained shallow, with buyers continuing to defend previous breakout levels.
The broader outlook remains bullish while price trades above 51,670. A breakout above 53,416 would resume the primary uptrend and expose 54,000. Should selling pressure increase, the first important support lies around 52,250, where buyers may attempt to re-enter the market.
Dow Jones Daily Chart
| Resistance | 52,893 – 52,900 | 53,340 – 53,360 | 53,600 – 53,610 |
| Support | 52,070 – 52,090 | 51,599 – 51,620 | 50,787 – 50,805 |
USDJPY Technical Analysis
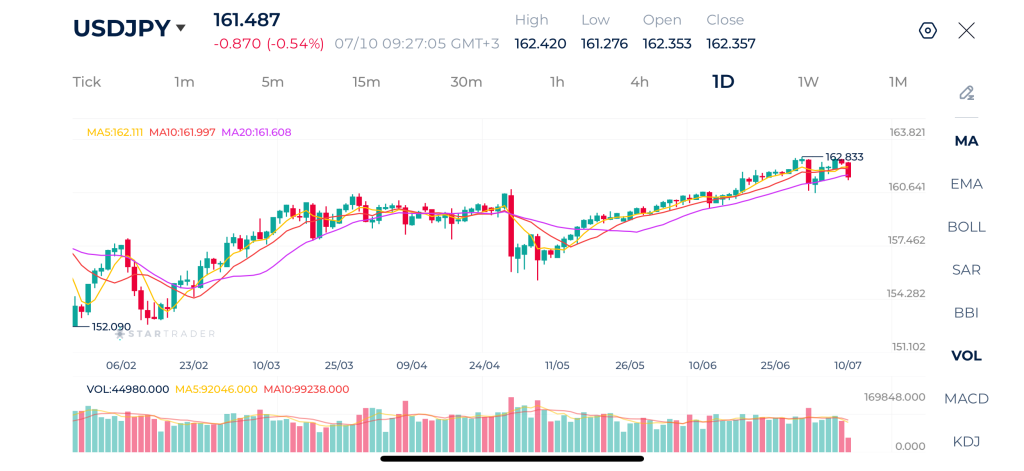
USDJPY remains in a well-established medium-term uptrend despite today’s corrective pullback. The pair recently reached a new swing high at 162.83 before retreating toward the 161.30–161.50 region. Price continues to trade above the rising 20-day moving average, while the 5-day MA remains above the 10-day and 20-day averages, confirming that the broader bullish structure remains intact.
The market continues to print higher highs and higher lows, although today’s bearish candle suggests profit-taking after an extended rally. Momentum has cooled slightly, but buyers continue to defend the rising moving averages, which are acting as dynamic support.
The medium-term outlook remains bullish while USDJPY holds above 160.65. A recovery above 162.00 would encourage another attempt at 162.83, with a potential extension toward 163.50. However, a sustained break below 160.65 would indicate a deeper corrective move toward 159.80.
USDJPY Daily Chart
| Resistance | 162.84 – 162.90 | 163.64 – 163.70 | 164.00 – 164.10 |
| Support | 160.50 – 160.55 | 159.59 – 159.80 | 158.61 – 158.70 |
Risk Disclaimer: This material is provided for informational purposes only and does not constitute a recommendation or investment advice. Trading financial instruments on margin involves substantial risk and may not be appropriate for all investors.
Tags


Open Live Account
 Email Address
 Phone Number
Important Notice
STARTRADER does not accept any applications from Australian residents.
To comply with regulatory requirements, clicking the button will redirect you to the STARTRADER website operated by STARTRADER PRIME GLOBAL PTY LTD (ABN 65 156 005 668), an authorized Australian Financial Services Licence holder (AFSL no. 421210) regulated by the Australian Securities and Investments Commission.
Important Notice for Residents of the United Arab Emirates
In alignment with local regulatory requirements, individuals residing in the United Arab Emirates are requested to proceed via our dedicated regional platform at startrader.ae, which is operated by STARTRADER Global Financial Consultation & Financial Analysis L.L.C.. This entity is licensed by the UAE Capital Market Authority (CMA) under License No. 20200000241, and is authorised to introduce financial services and promote financial products in the UAE.
Please click the "Continue" button below to be redirected.


