


Gold Technical Analysis
XAUUSD showed significant gains yesterday. Today’s movement also confirms the bullish momentum. The 5-period moving average is above the 10-period MA, which is also above the 30-period MA, forming a strong bullish alignment. The price is trading well above all three moving averages, indicating strong upward momentum. The moving averages are acting as dynamic support.
The MACD line is well above the Signal line, which is a clear and powerful bullish signal, confirming the strength of the current rally. The convergence is strong, showing that momentum is accelerating to the upside. A breakout and sustained trade above the recent high would likely push the price higher towards the next psychological and structural resistance levels.
Gold 1H Chart
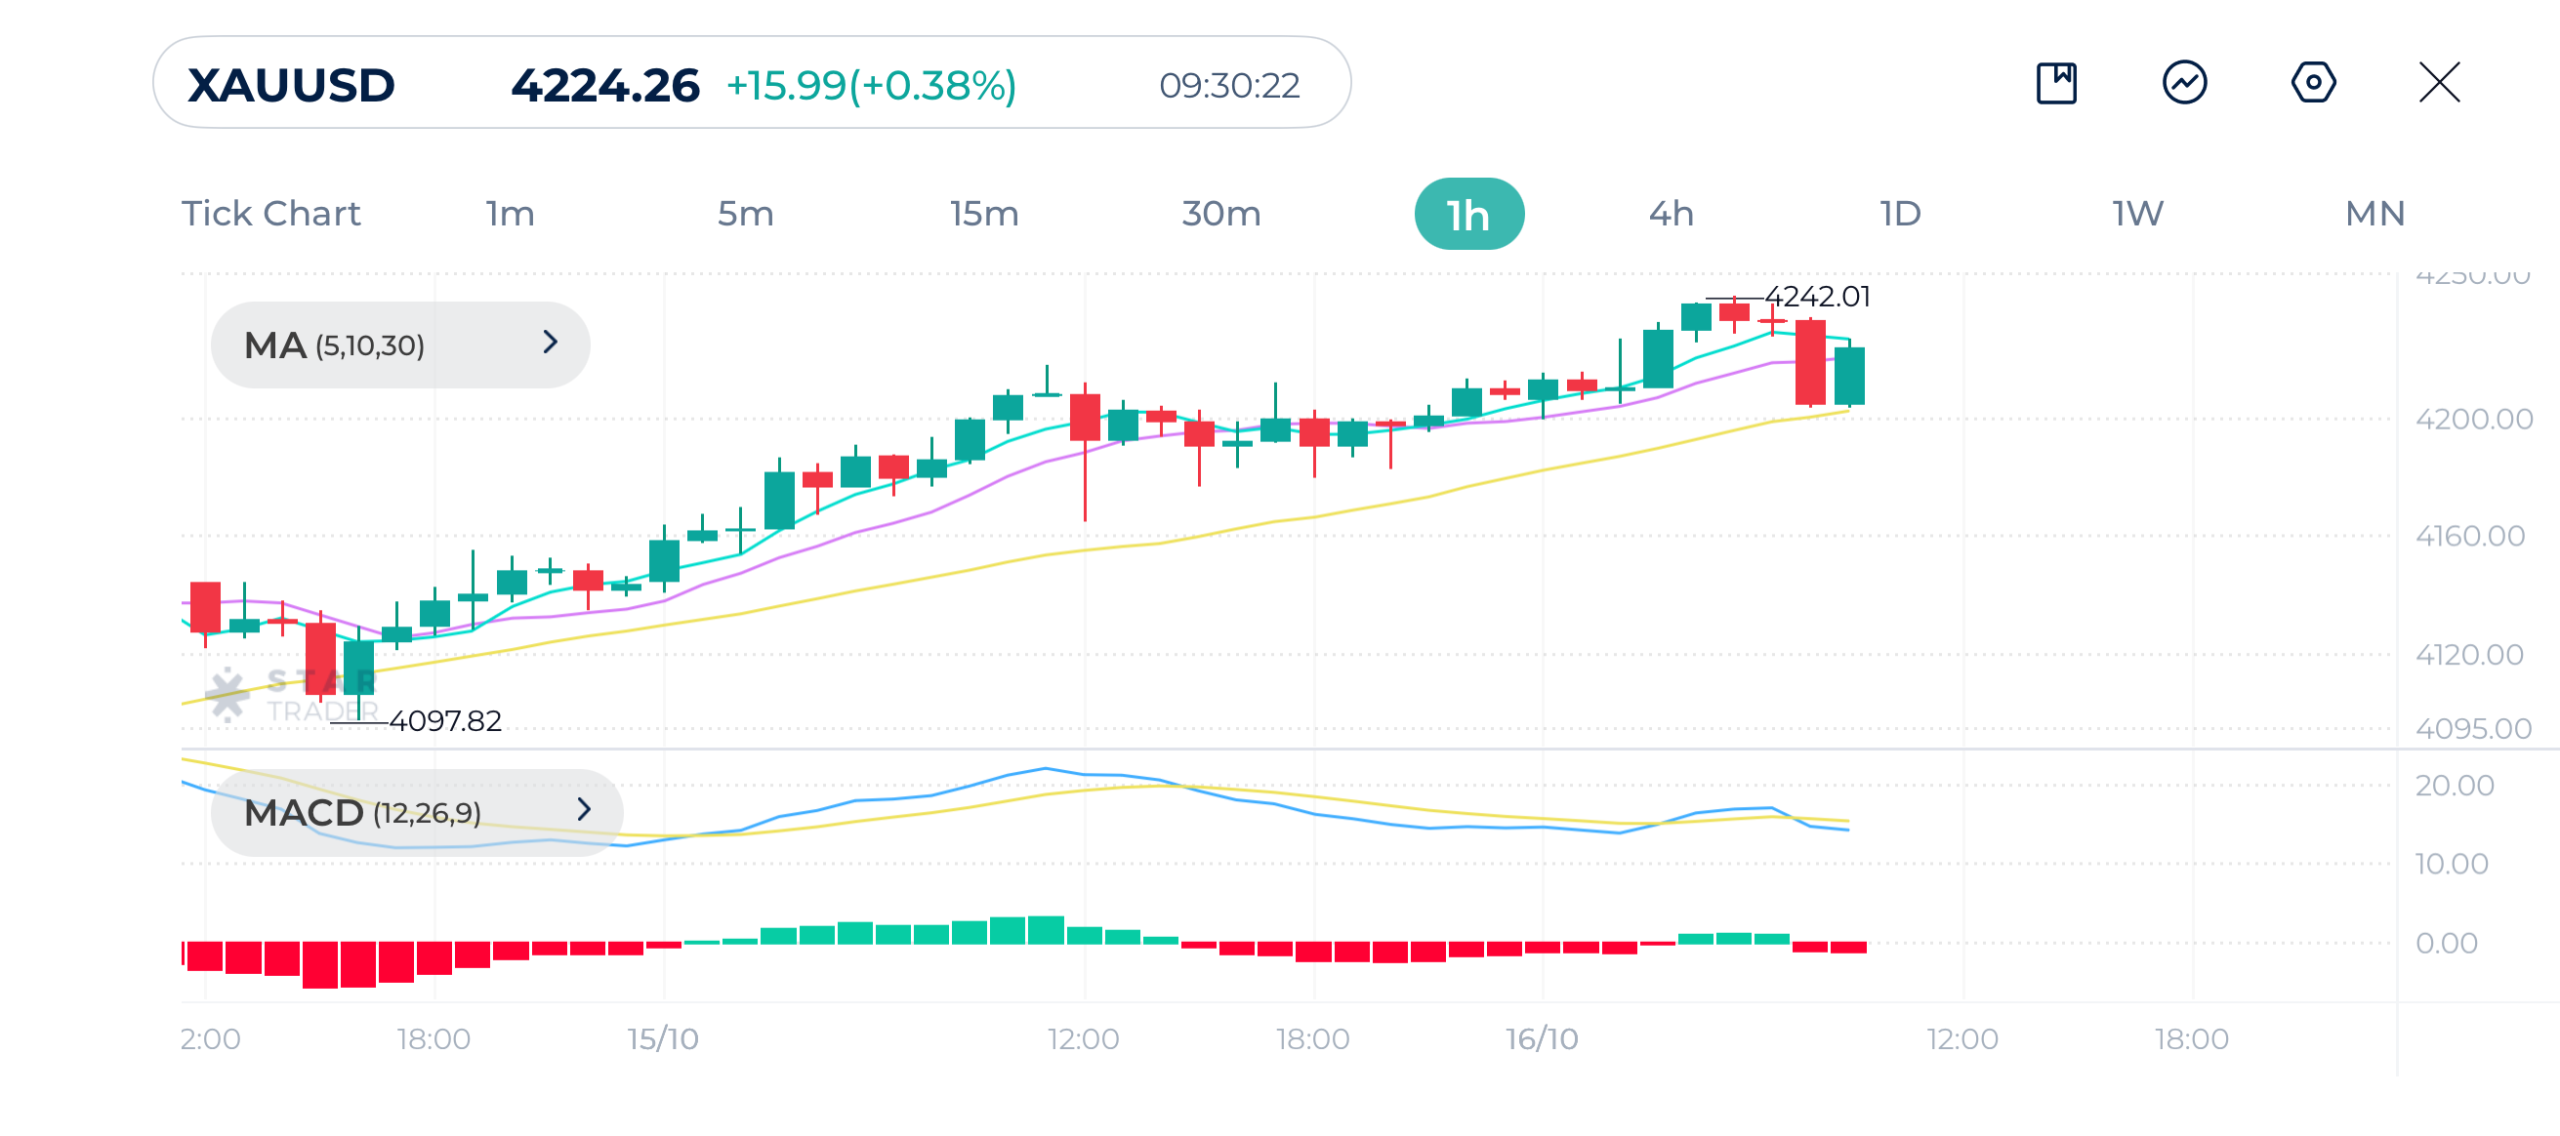
| Resistance | $4,242 | $4,250 | $4,275 |
| Support | $4,203 | $4,179 | $4,164 |
EURUSD Technical Analysis
EURUSD is in a short-term upward swing. The moving averages are currently showing bullish momentum.The short-term trend is still positive.
The MACD line is above the signal line. The reading is positive and rising, which is indicating growing upward momentum following the recent price dip.
A decisive push and close above the approx 1.1675 resistance would confirm the short-term bullish trend and target higher levels. However, a drop back below the moving averages would indicate the uptrend attempt has failed, potentially leading to a retest of 1.1542
EURUSD 1H Chart
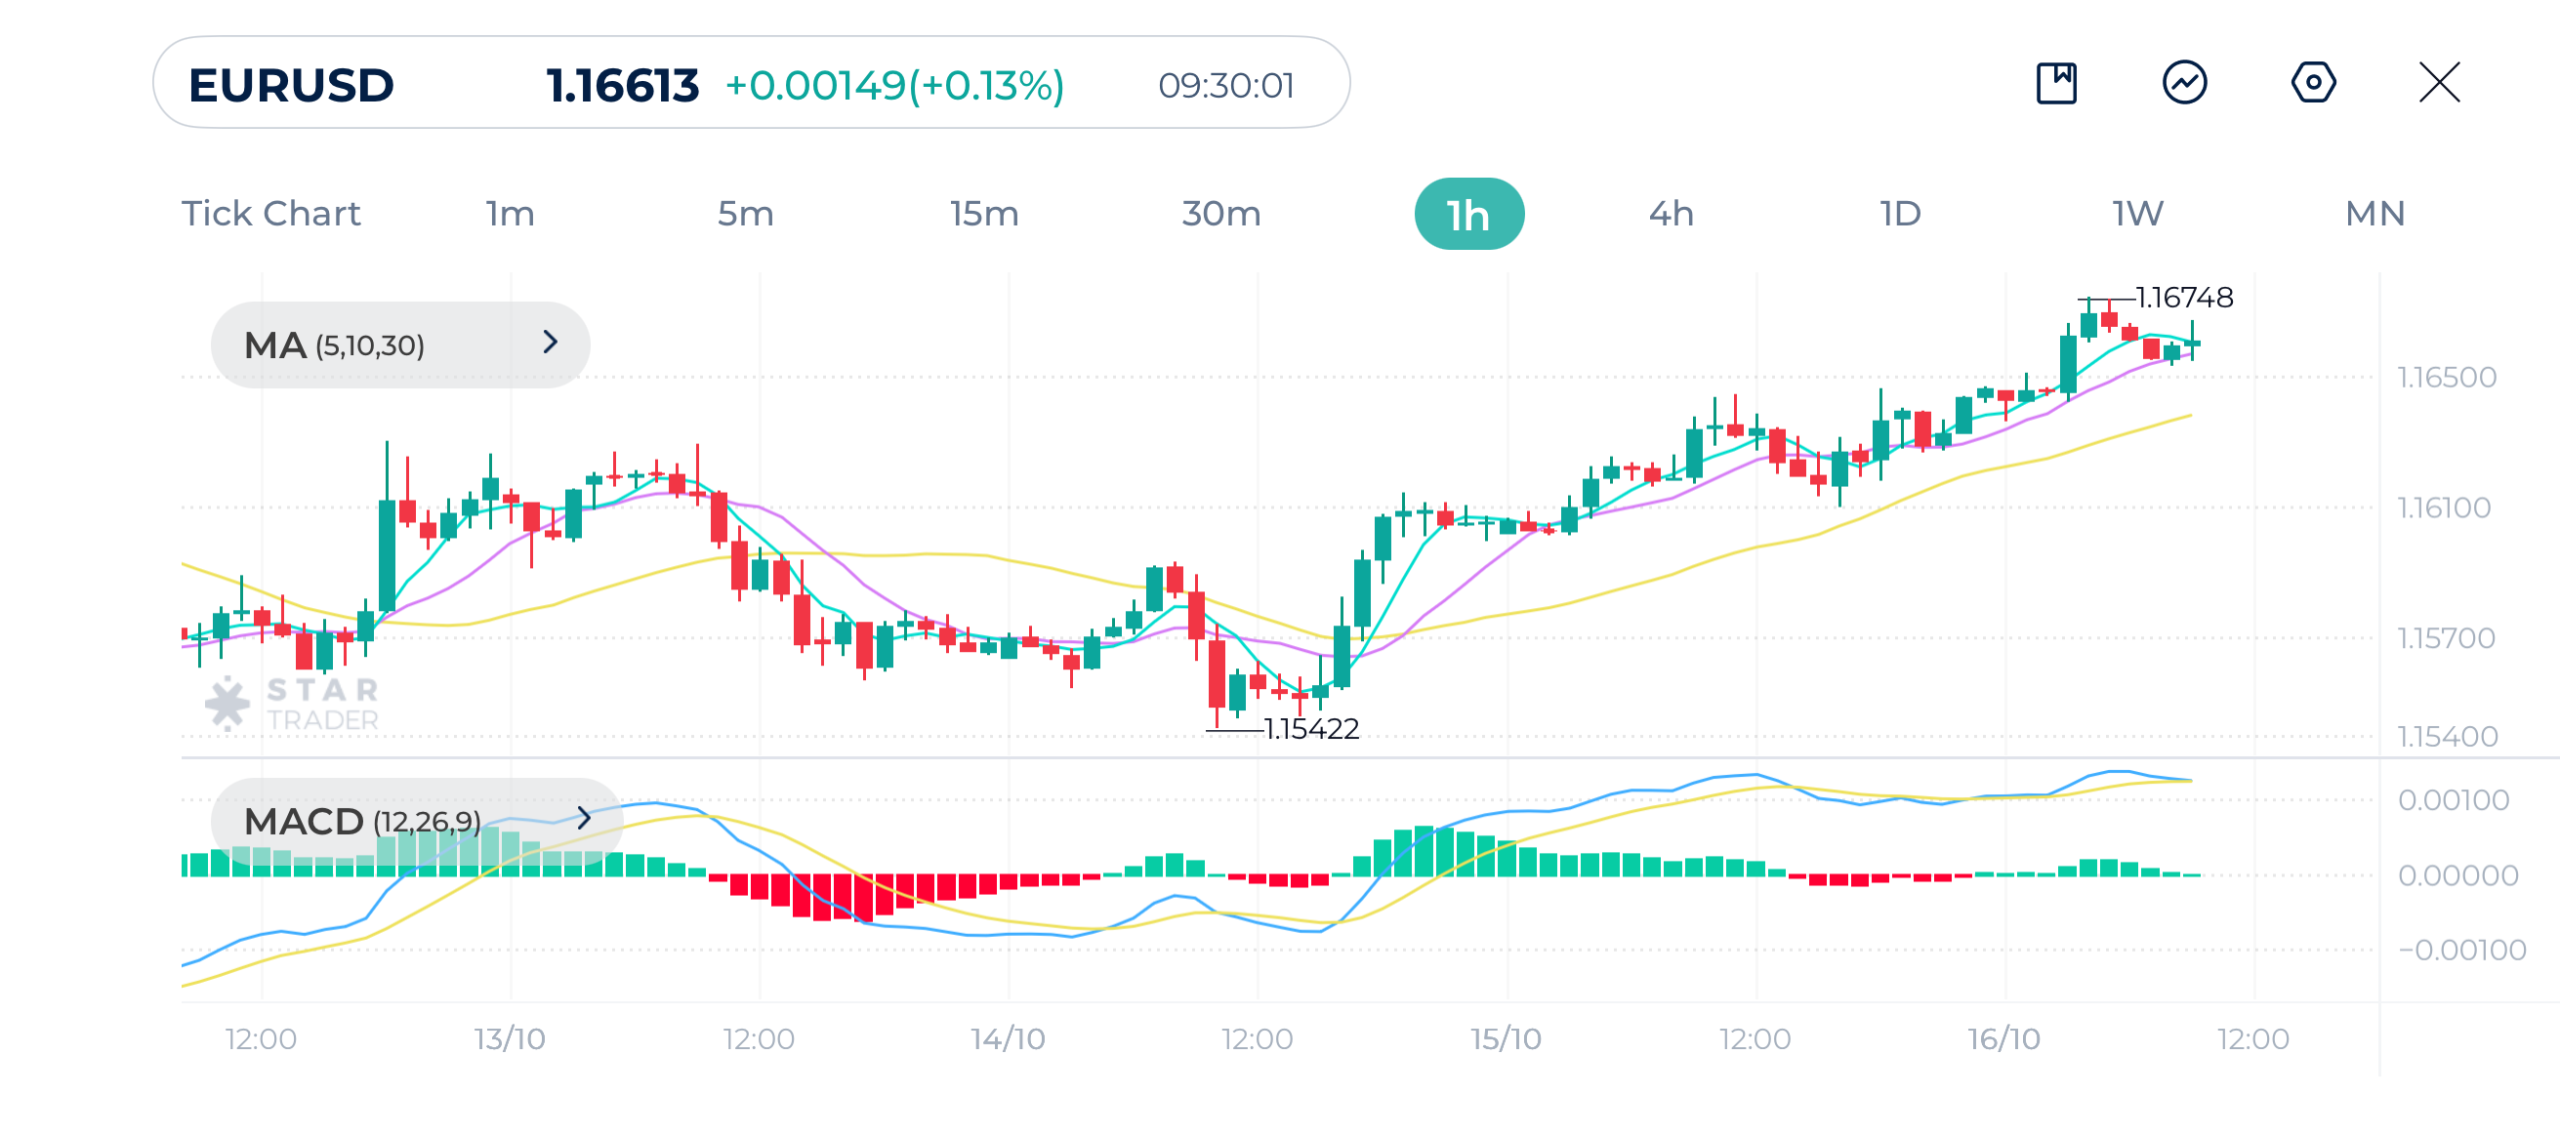
| Resistance | 1.1668 | 1.1720 | 1.1756 |
| Support | 1.1640 | 1.1612 | 1.1578 |
Nasdaq Technical Analysis
Nasdaq 100 shows modest recovery on the hourly chart, suggesting buying interest. All moving averages are tightly grouped and generally flat.
The MACD line and signal line are very close, near the zero line. This signals loss of momentum and a sideways market in the immediate short term.
A sustained break and trade above the recent high 24,960 would confirm a return of bullish momentum, targeting the 25000 psychological level.
However, a failure to hold above the moving averages and a drop back towards the 24,600 level would threaten the recent recovery and could lead to a retest of the 24,268 low.
Nasdaq 1H Chart
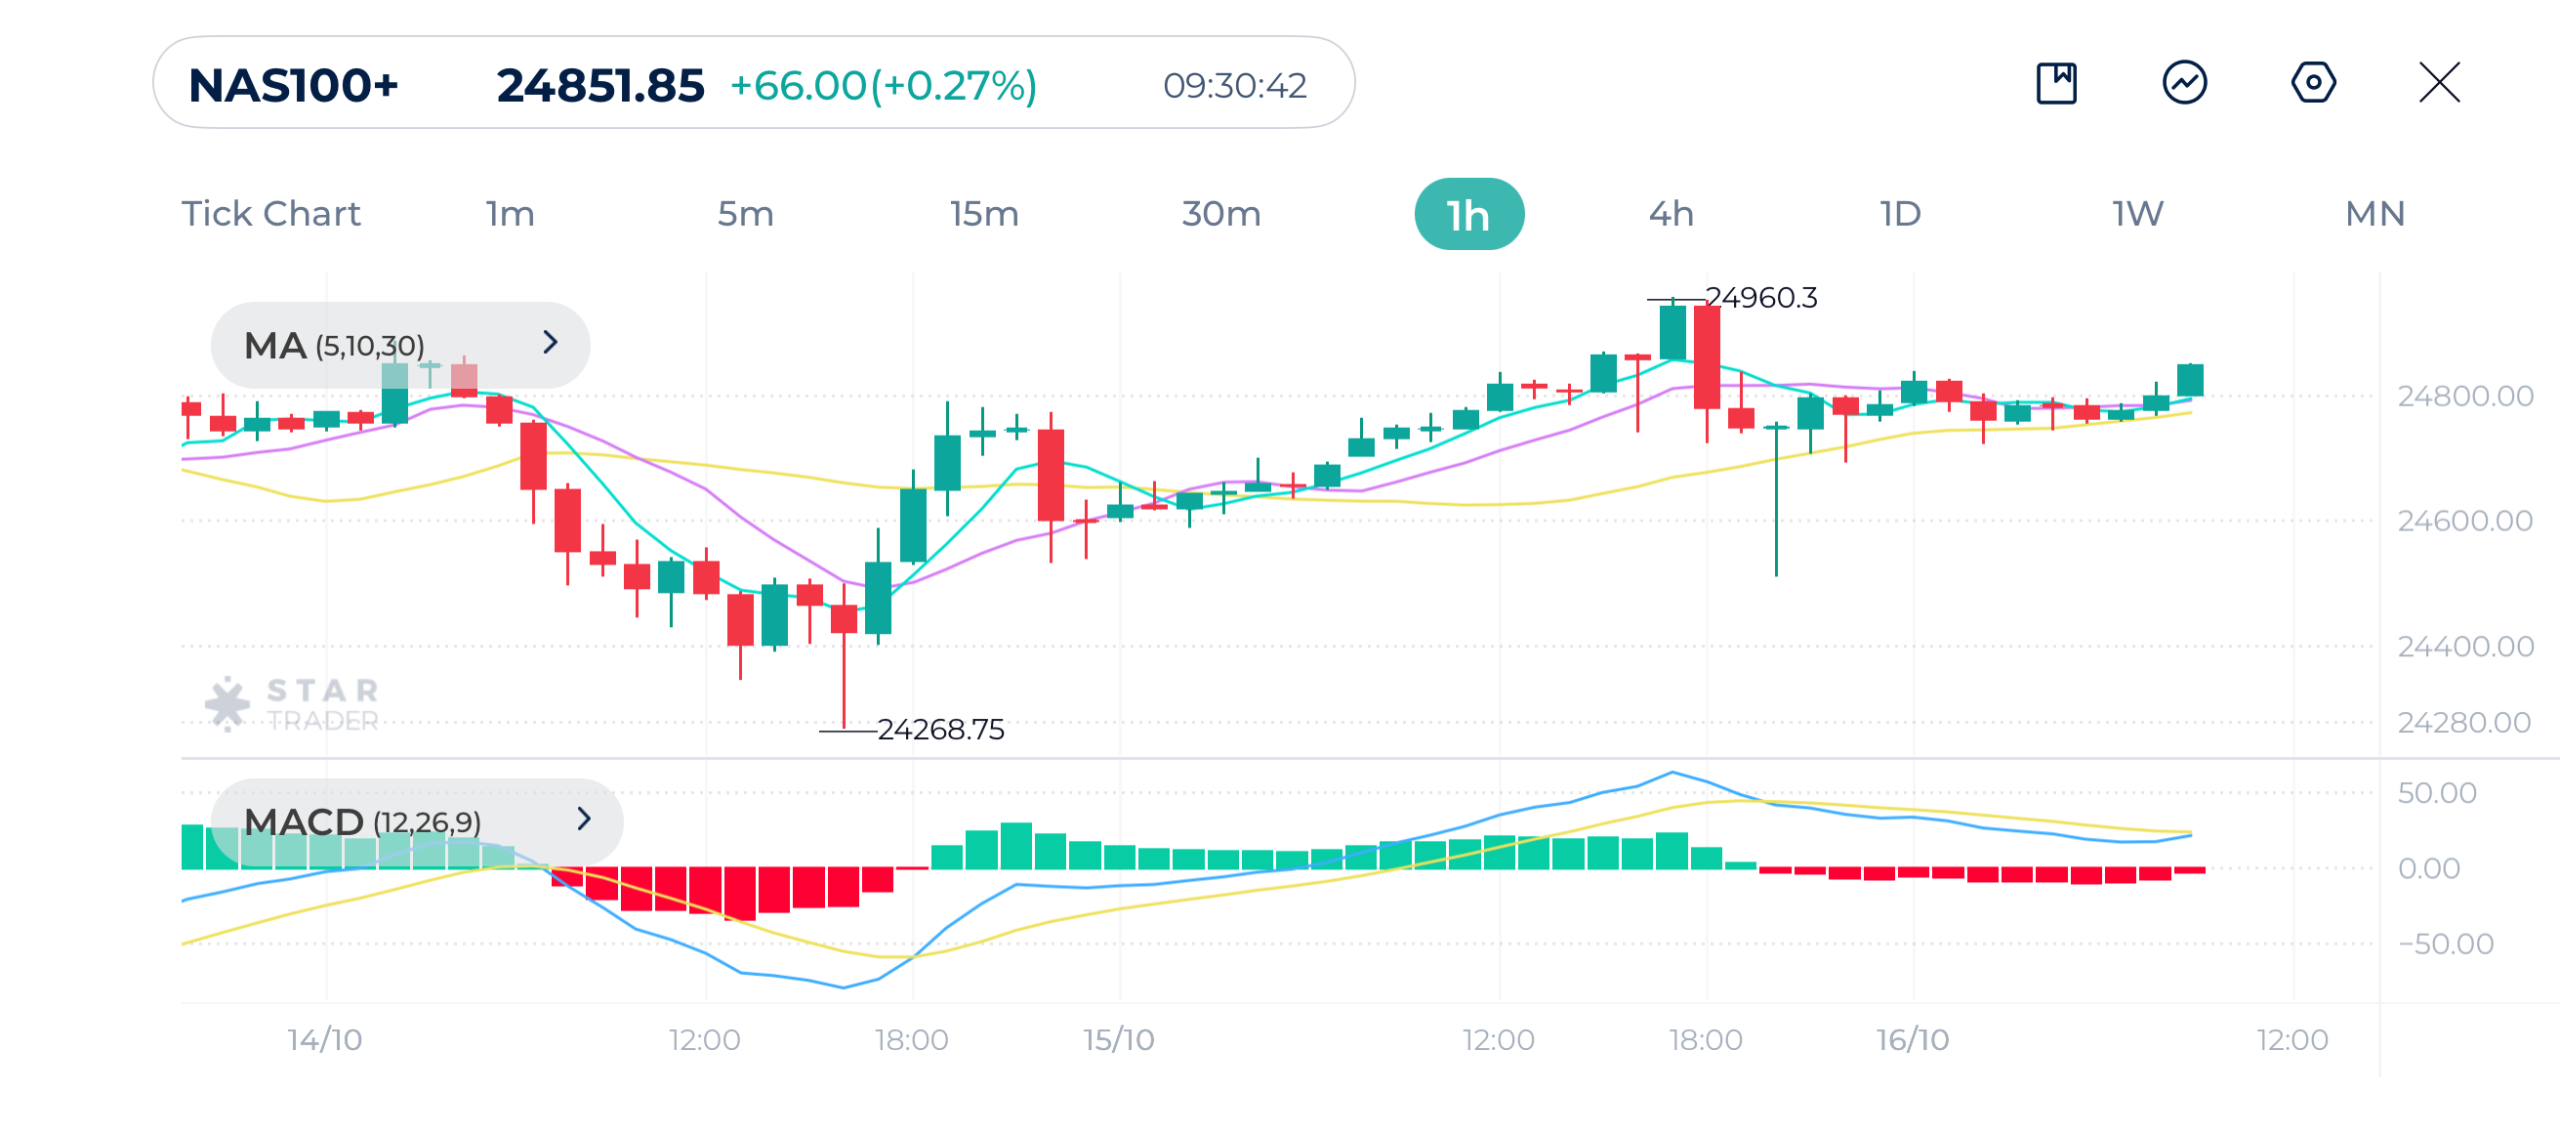
| Resistance | 24,940 | 25,050 | 25,125 |
| Support | 24,721 | 24,565 | 24,484 |
Tags
Open Live Account
Please enter a valid country
No results found
No results found
Please enter a valid email
Please enter a valid verification code
1. 8-16 characters + numbers (0-9) 2. blend of letters (A-Z, a-z) 3. special characters (e.g, !a#S%^&)
Please enter the correct format
Please tick the checkbox to proceed
Please tick the checkbox to proceed
Important Notice
STARTRADER does not accept any applications from Australian residents.
To comply with regulatory requirements, clicking the button will redirect you to the STARTRADER website operated by STARTRADER PRIME GLOBAL PTY LTD (ABN 65 156 005 668), an authorized Australian Financial Services Licence holder (AFSL no. 421210) regulated by the Australian Securities and Investments Commission.
CONTINUEImportant Notice for Residents of the United Arab Emirates
In alignment with local regulatory requirements, individuals residing in the United Arab Emirates are requested to proceed via our dedicated regional platform at startrader.ae, which is operated by STARTRADER Global Financial Consultation & Financial Analysis L.L.C.. This entity is licensed by the UAE Capital Market Authority (CMA) under License No. 20200000241, and is authorised to introduce financial services and promote financial products in the UAE.
Please click the "Continue" button below to be redirected.
CONTINUEError! Please try again.

