








 Web Trader MT5











Bitcoin Technical Analysis
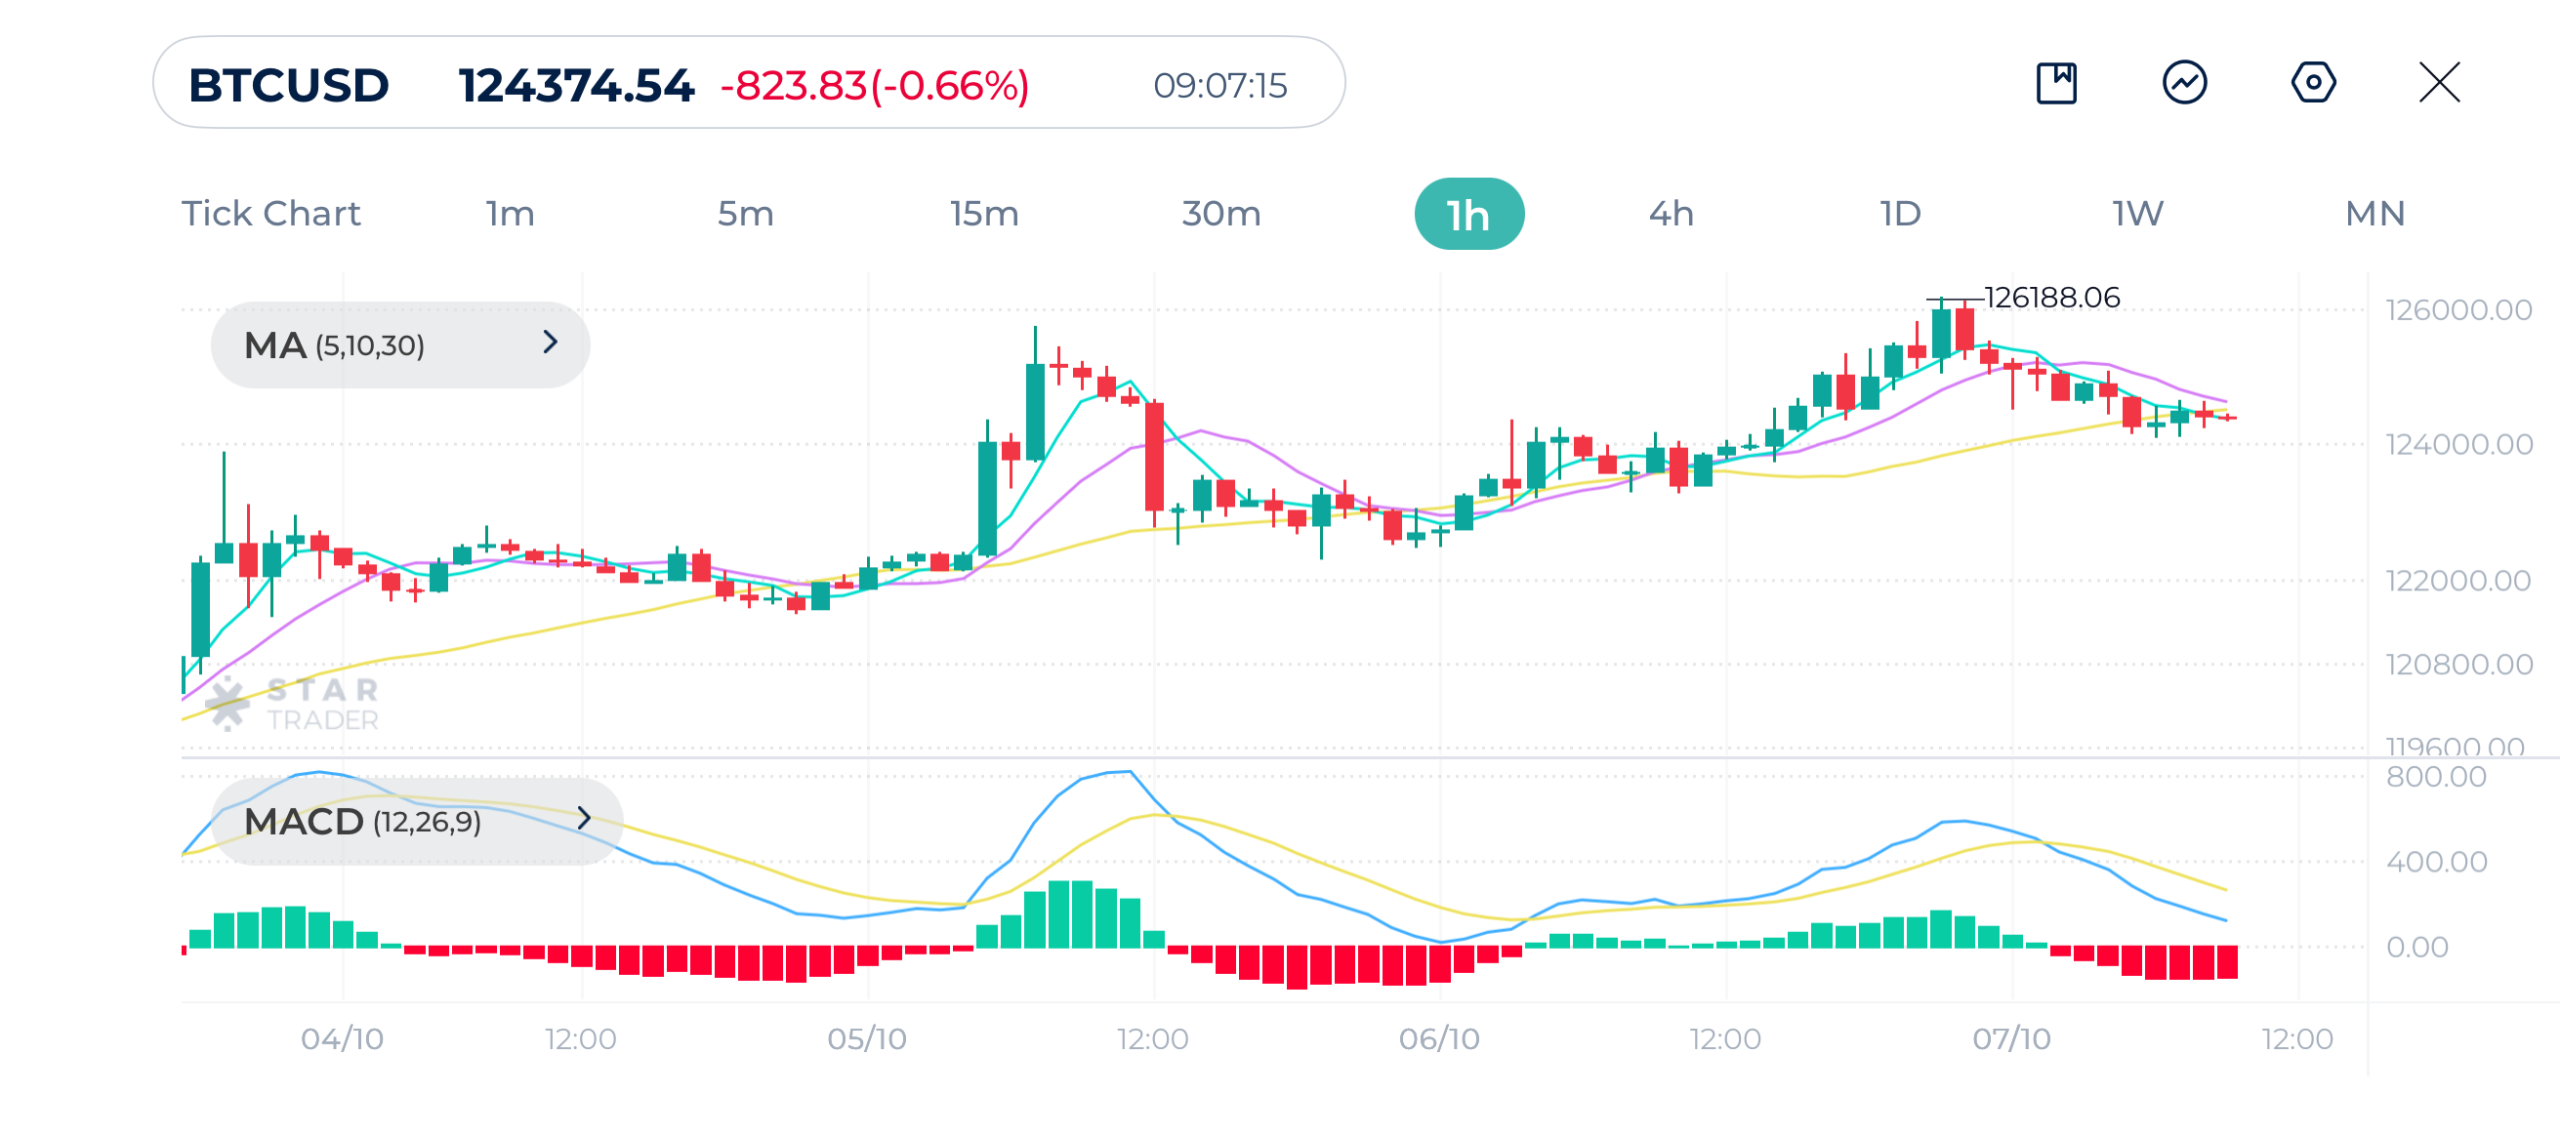
Bitcoin has seen a minor bearish correction on the hourly chart after peaking above $126,200 yesterday, and now showing signs of short-term consolidation. The 30-period MA acts as dynamic support, while the 5- and 10-period moving averages slope downward, signaling mild bearish momentum.
Price is currently hovering just above the 30 MA, indicating a neutral to slightly bearish tone.
MACD is below the signal line, confirming short-term selling pressure. Buyers are likely to defend around the $124,000 psychological zone, which aligns with recent price congestion.
If bitcoin holds above $124,000, buyers could reattempt $125,500–$126,000. However, below $124,000, a retracement toward $122,800 becomes likely.
Bitcoin (BTCUSD) 1H Chart
| Resistance | $125,139 | $125,684 | $126,230 |
| Support | $123,780 | $123,336 | $122,400 |
Gold Technical Analysis
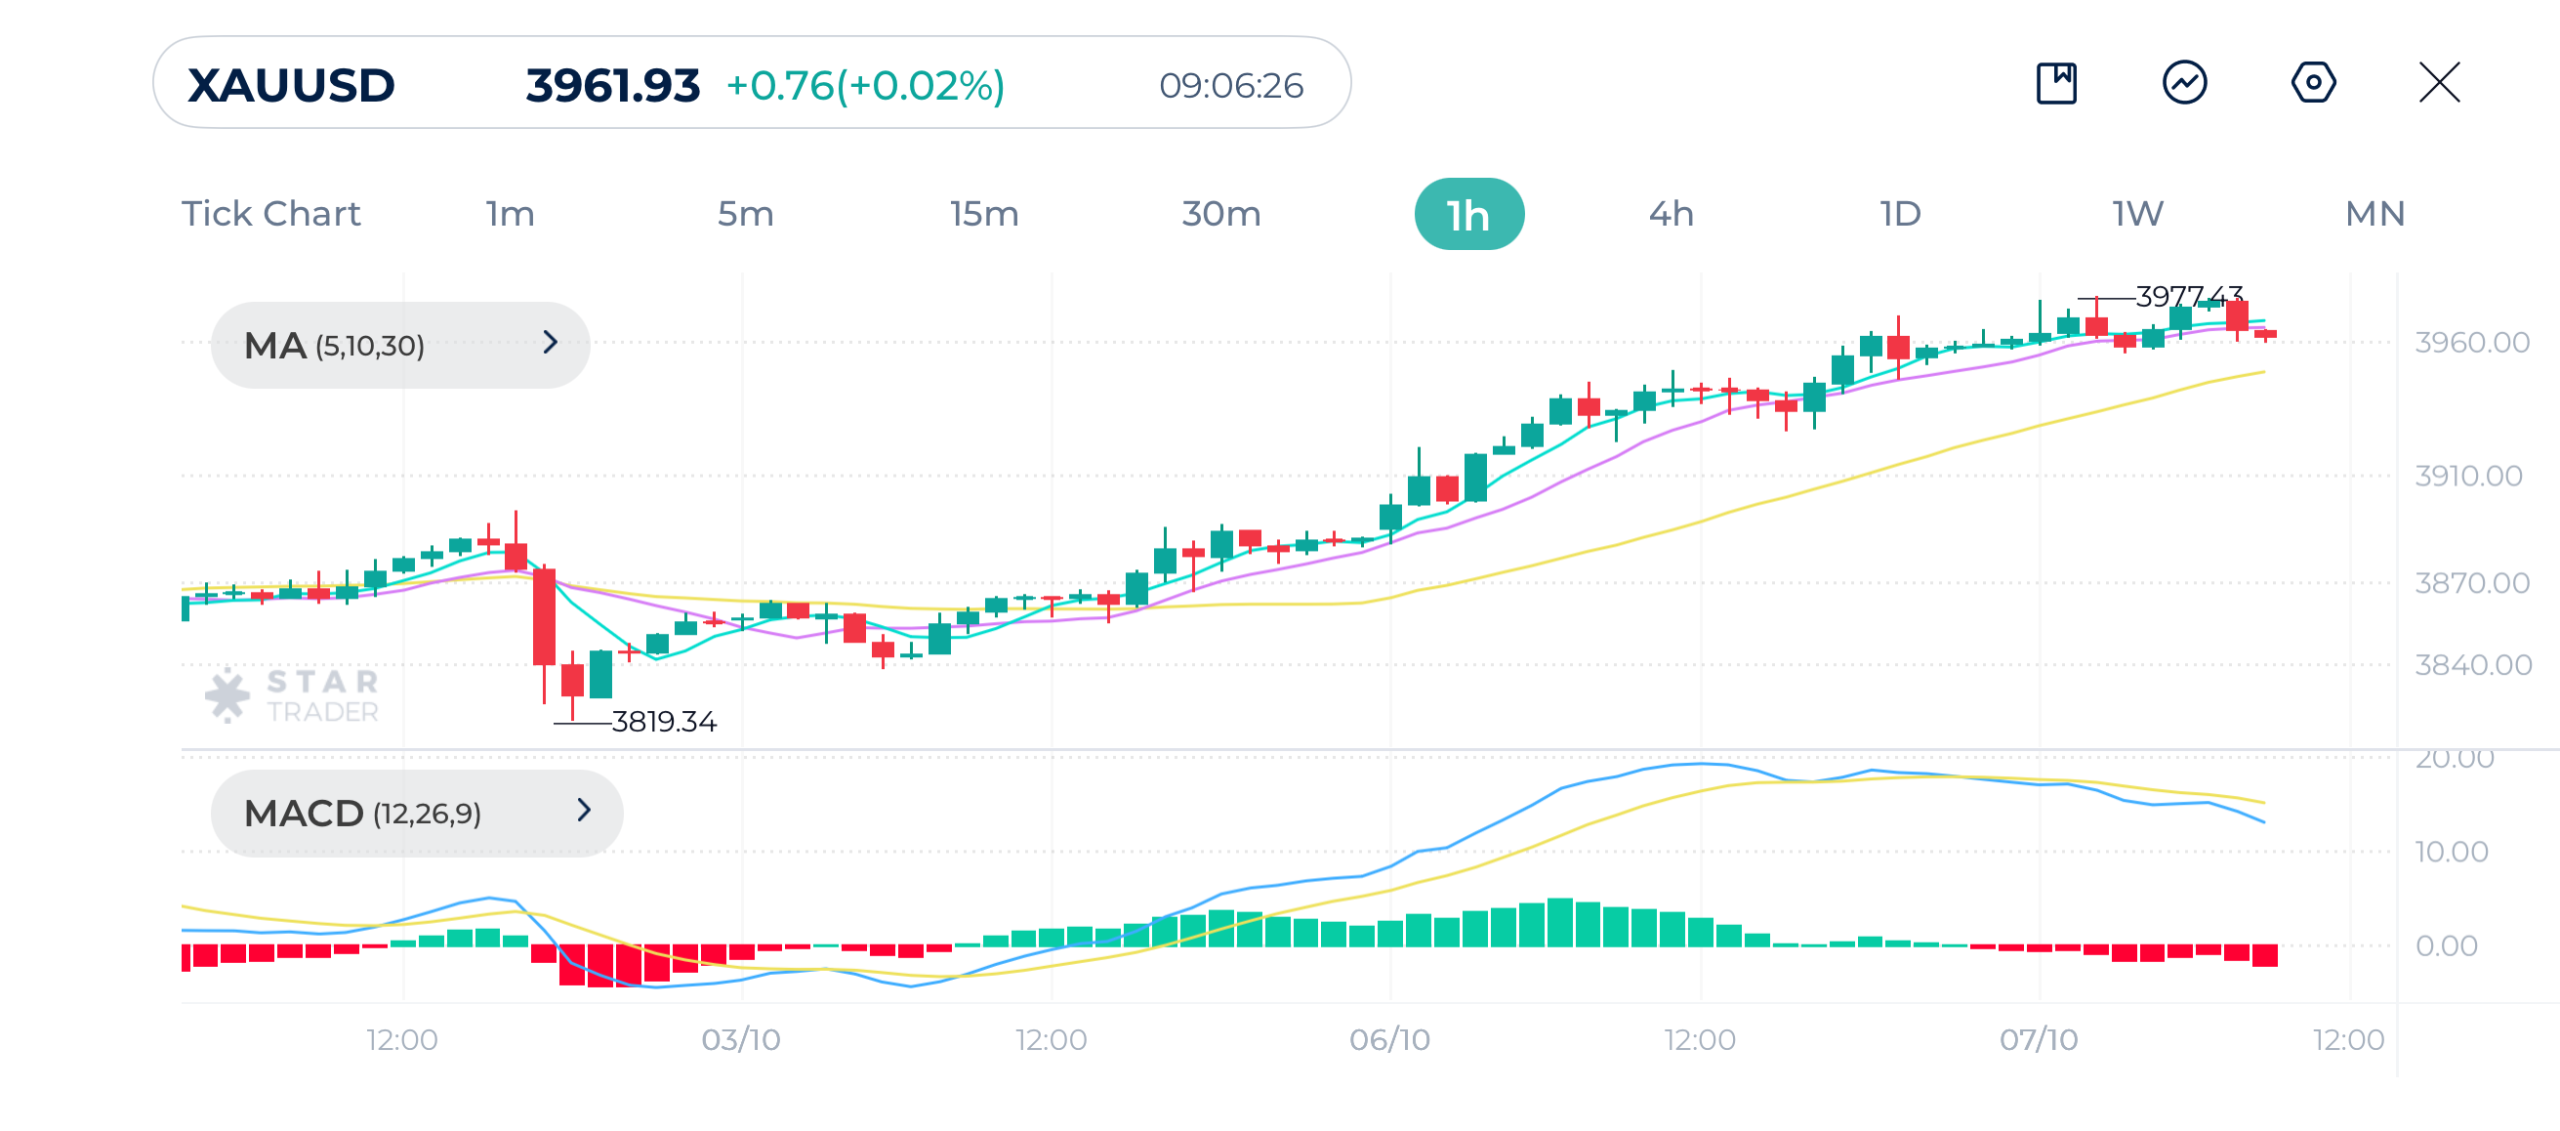
Gold continues to trade in a strong bullish structure, as it reached a new record high at $3,977 recently. Price remains above the 30-period moving average, and short-term MAs (5,10) are still above the 30 MA a sign of ongoing uptrend despite minor consolidation. The market is digesting gains near $3,960 after a sharp rise.
MACD line is below the signal line, a sign of short-term cooling off.
Recent candles show sideways consolidation following a strong bullish impulse. Buyers are defending $3,950, showing that sentiment remains positive.
Gold remains bullish as long as it stays above $3,925. A push above $3,975 could open the way to $3,990–$4,000, while a break below $3,925 could start a deeper correction.
Gold (XAUUSD) 1H Chart
| Resistance | $3,977 | $4,000 | $4,025 |
| Support | $3,945 | $3,922 | $3,889 |
Russell 2000 Technical Analysis
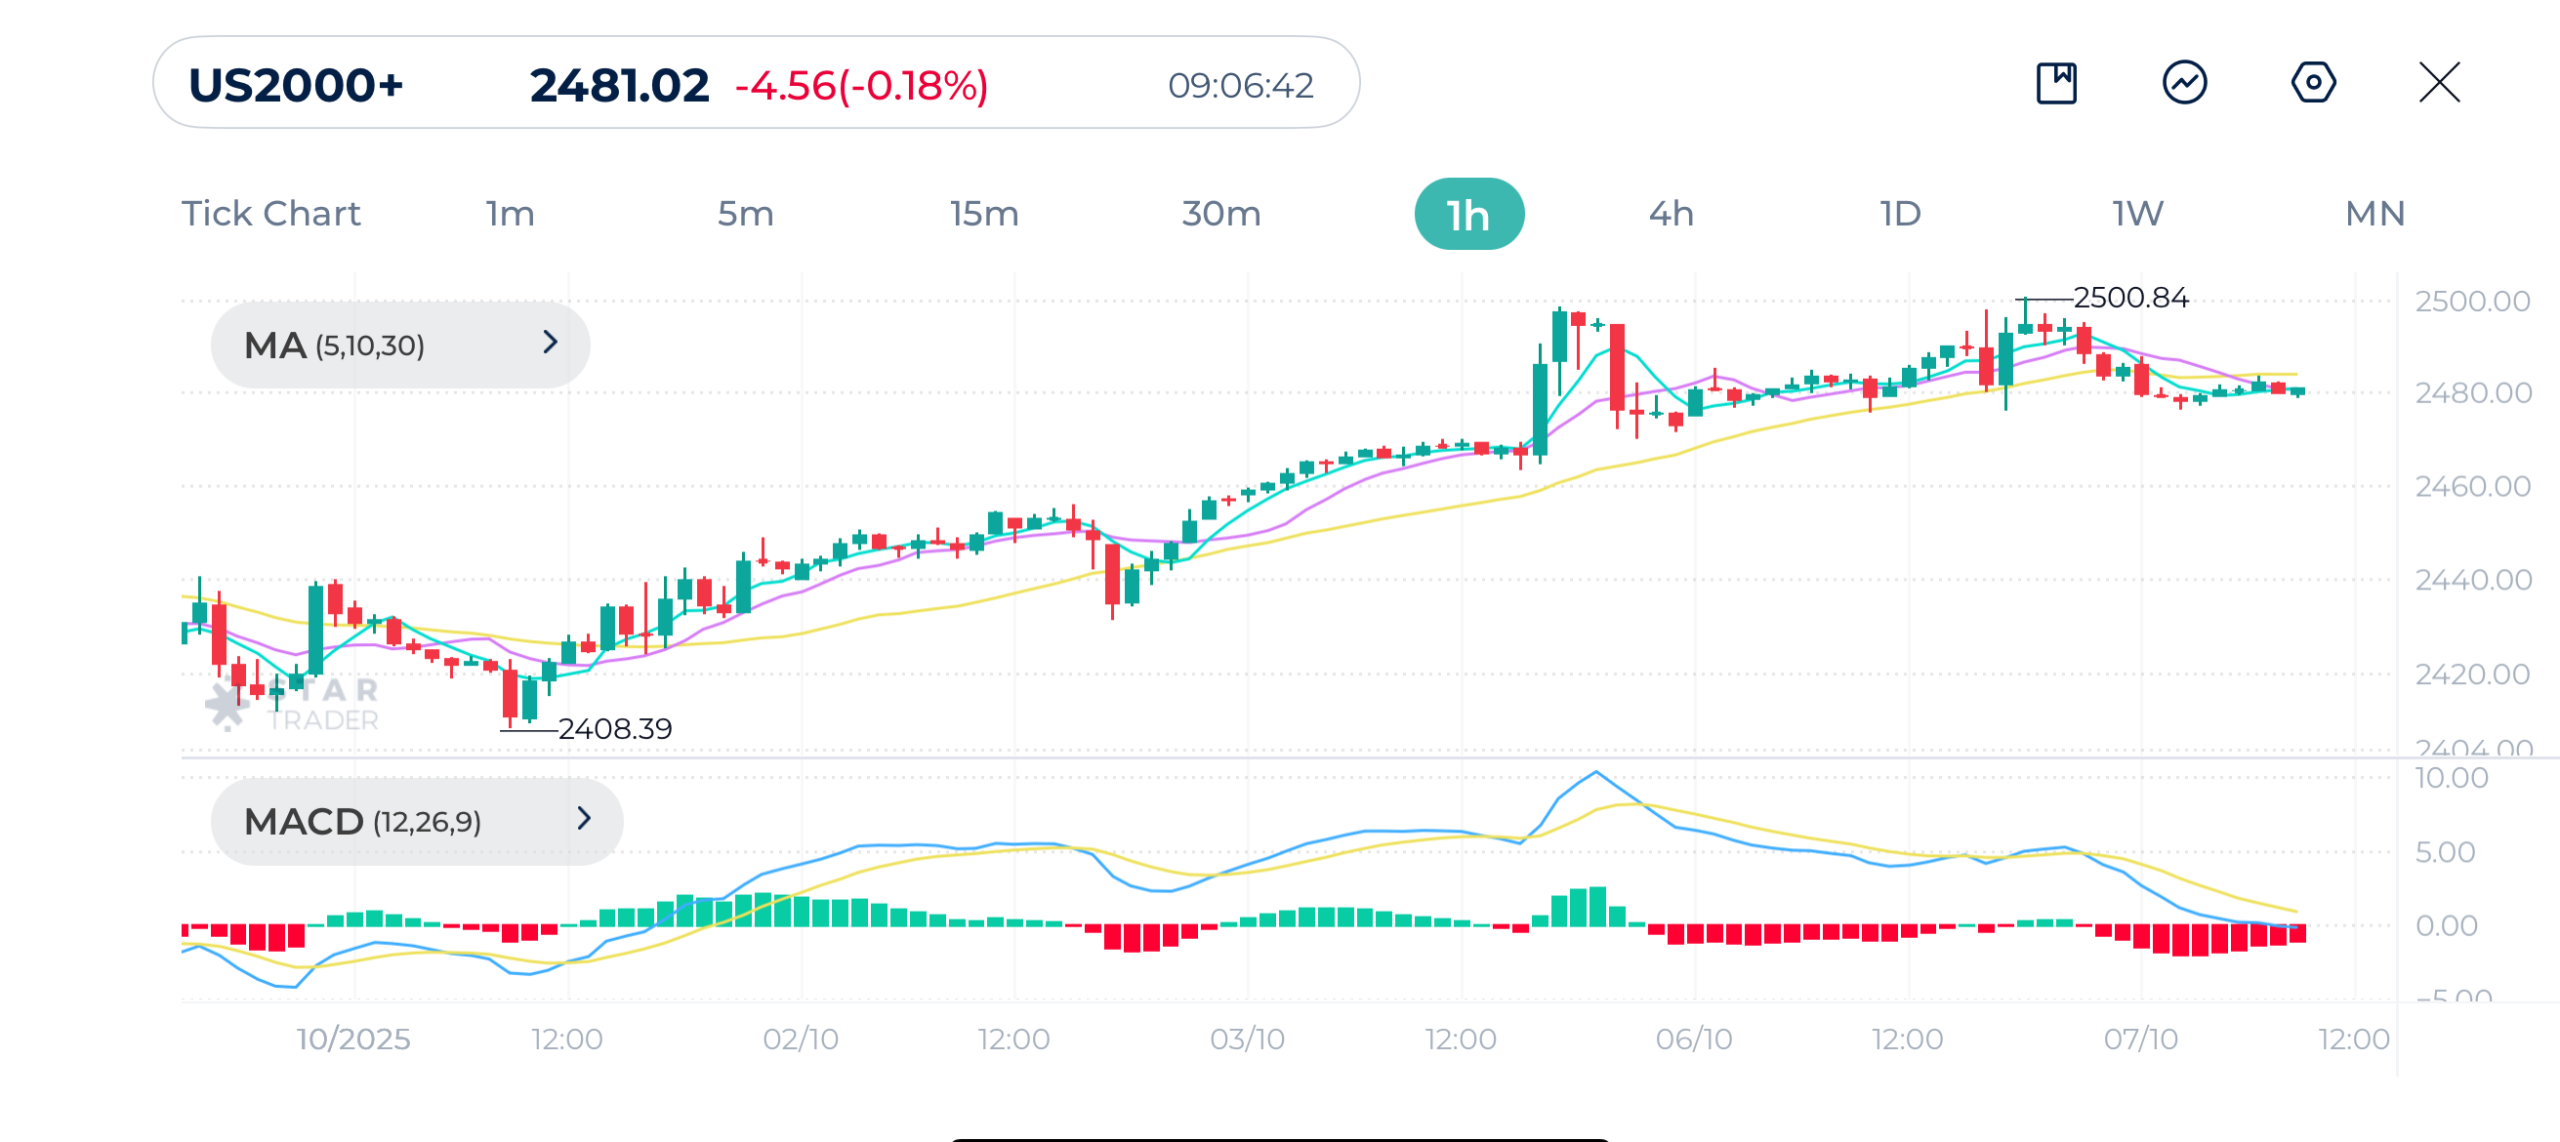
Russel 2000 broke a new all-time high above 2,500 in yesterday’s session before entering a mild correction. The short-term moving averages MA(5 & 10) have crossed below the 30-period moving average, indicating a near-term shift to bearish momentum. Overall, the index remains in a broader uptrend, but currently undergoing a short-term pullback.
MACD is below the signal line, which shows building bearish pressure. Sellers are beginning to dominate, but key support near 2,470–2,460 may slow the decline.
Russell 2000 may consolidate between 2,470–2,500. A sustained break above 2,505 could resume the uptrend, while a drop below 2,470 may invite deeper correction toward 2,450.
Russell 1H Chart
| Resistance | 2,490 | 2,500 | 2,525 |
| Support | 2,471 | 2,464 | 2,455 |
Tags


Open Live Account
 Email Address
 Phone Number
Important Notice
STARTRADER does not accept any applications from Australian residents.
To comply with regulatory requirements, clicking the button will redirect you to the STARTRADER website operated by STARTRADER PRIME GLOBAL PTY LTD (ABN 65 156 005 668), an authorized Australian Financial Services Licence holder (AFSL no. 421210) regulated by the Australian Securities and Investments Commission.
Important Notice for Residents of the United Arab Emirates
In alignment with local regulatory requirements, individuals residing in the United Arab Emirates are requested to proceed via our dedicated regional platform at startrader.ae, which is operated by STARTRADER Global Financial Consultation & Financial Analysis L.L.C.. This entity is licensed by the UAE Capital Market Authority (CMA) under License No. 20200000241, and is authorised to introduce financial services and promote financial products in the UAE.
Please click the "Continue" button below to be redirected.


