








 Web Trader MT5













Bitcoin Technical Analysis
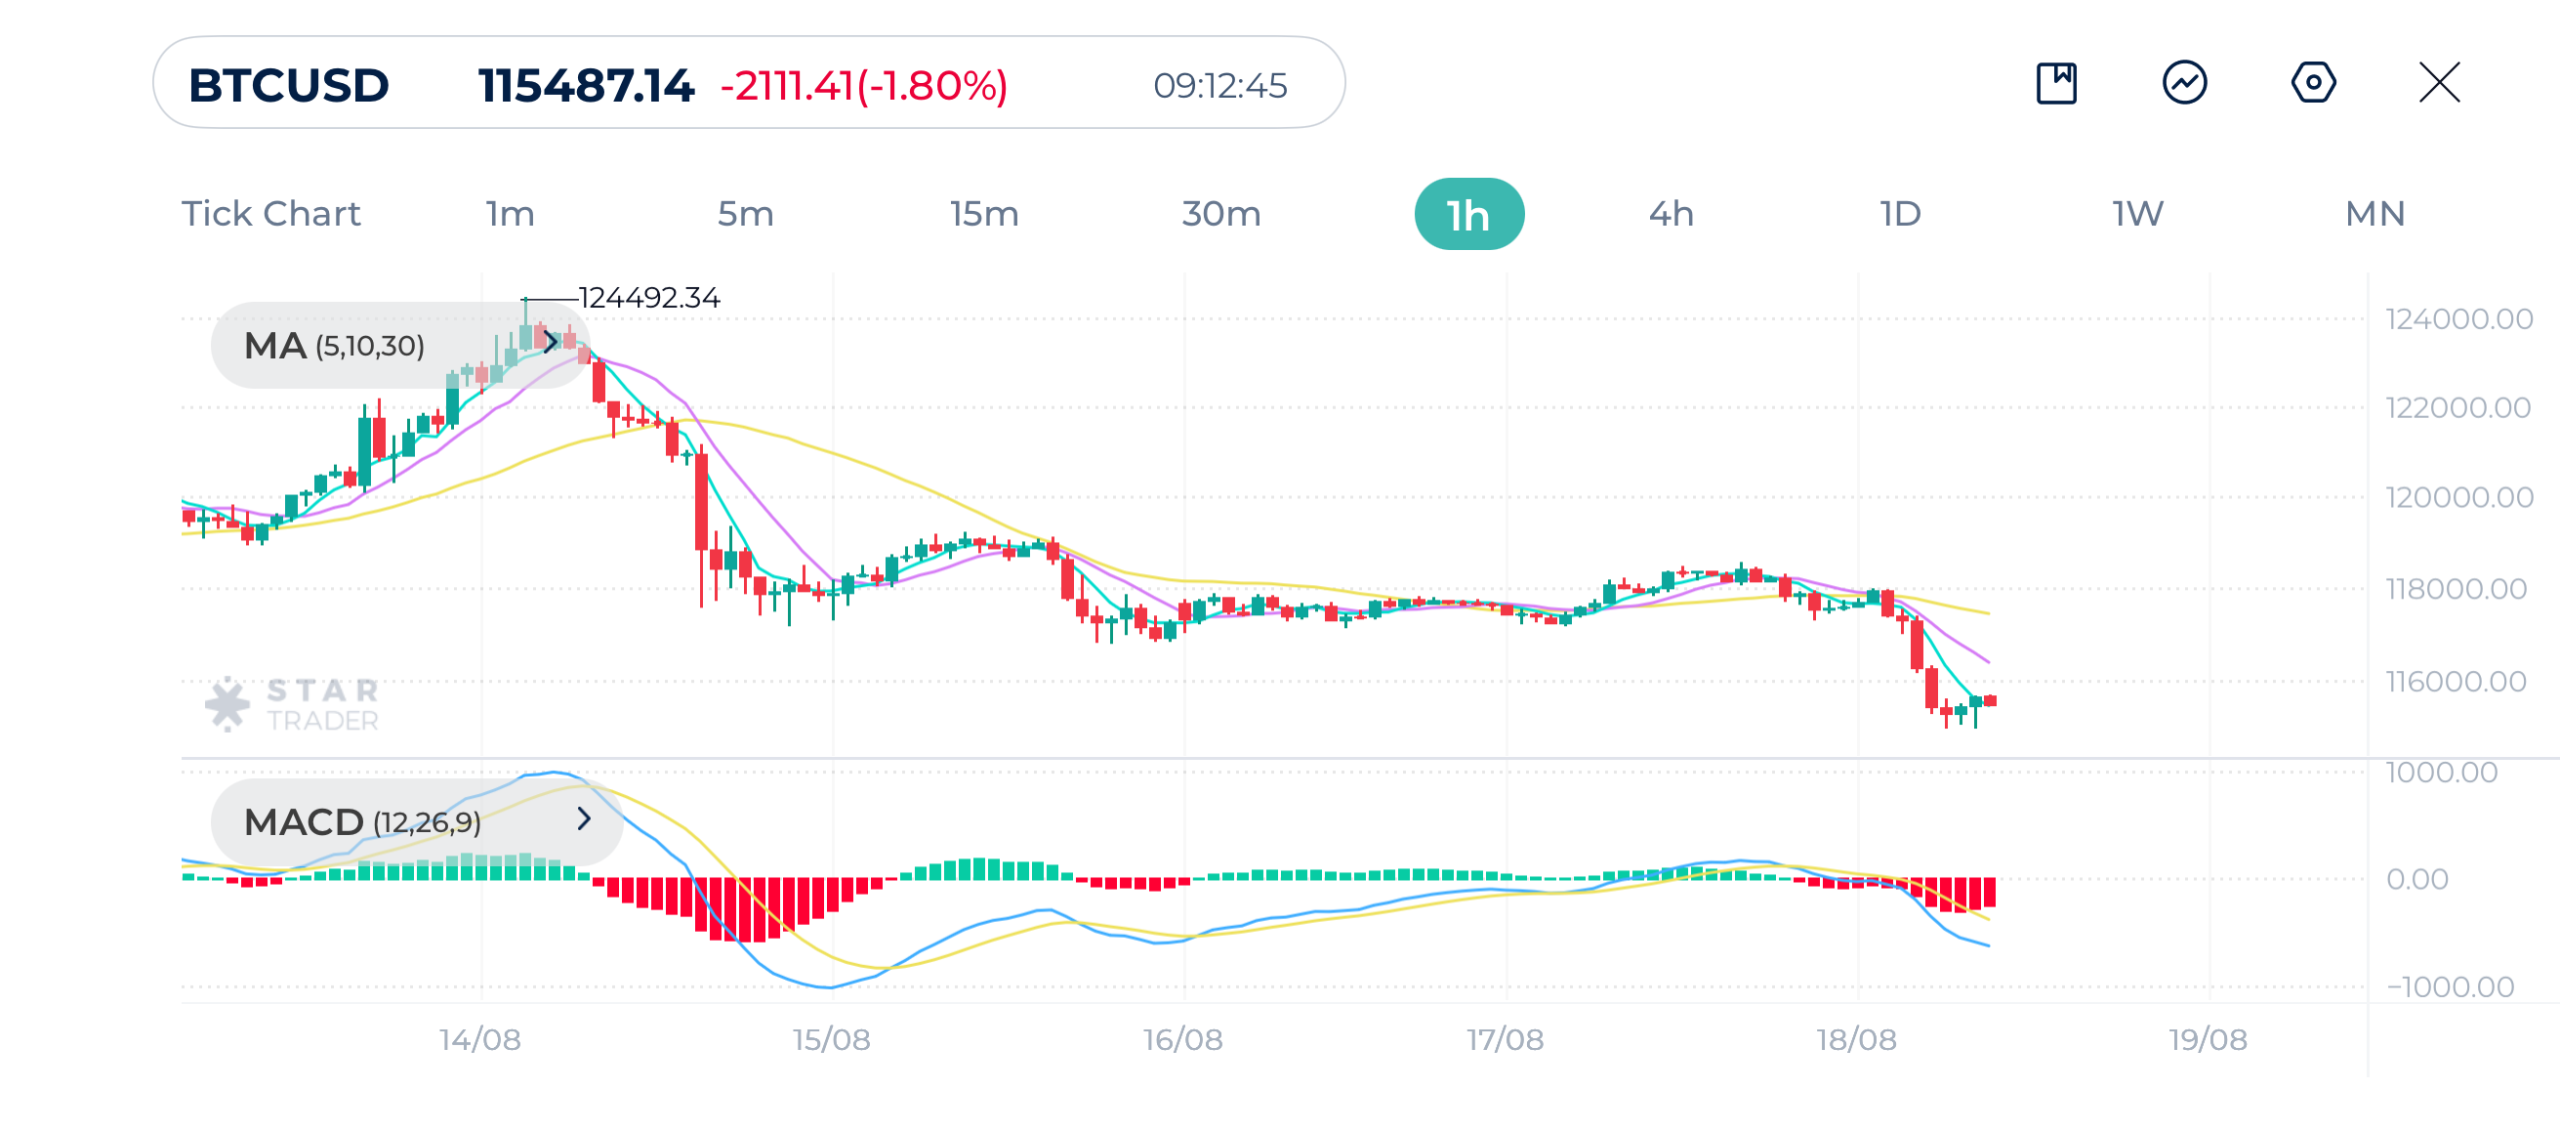
Bitcoin is trading at $115,487, down 1.8% since Monday’s open. The chart shows a sharp rejection after touching the recent all-time high $124,492, followed by a strong decline with lower highs and lower lows.
The three moving averages MA(5), MA(10), and MA(30) are aligned bearishly, with the short-term moving averages well below the longer averages. The MACD indicator is in the red, and the signal line is sloping downward, confirming strong bearish momentum.
Price is currently testing minor support around $115,000, which is also a psychological level. If this breaks, the next support is near $112,000–$113,000.
To regain strength, buyers would need to reclaim $118,000 first. This might push prices back to their record highs seen last week.
Bitcoin (BTCUSD) 1H Chart
| Resistance | $116,873 | $117,597 | $118,635 |
| Support | $115,068 | $114,346 | $113,617 |
EURUSD Technical Analysis
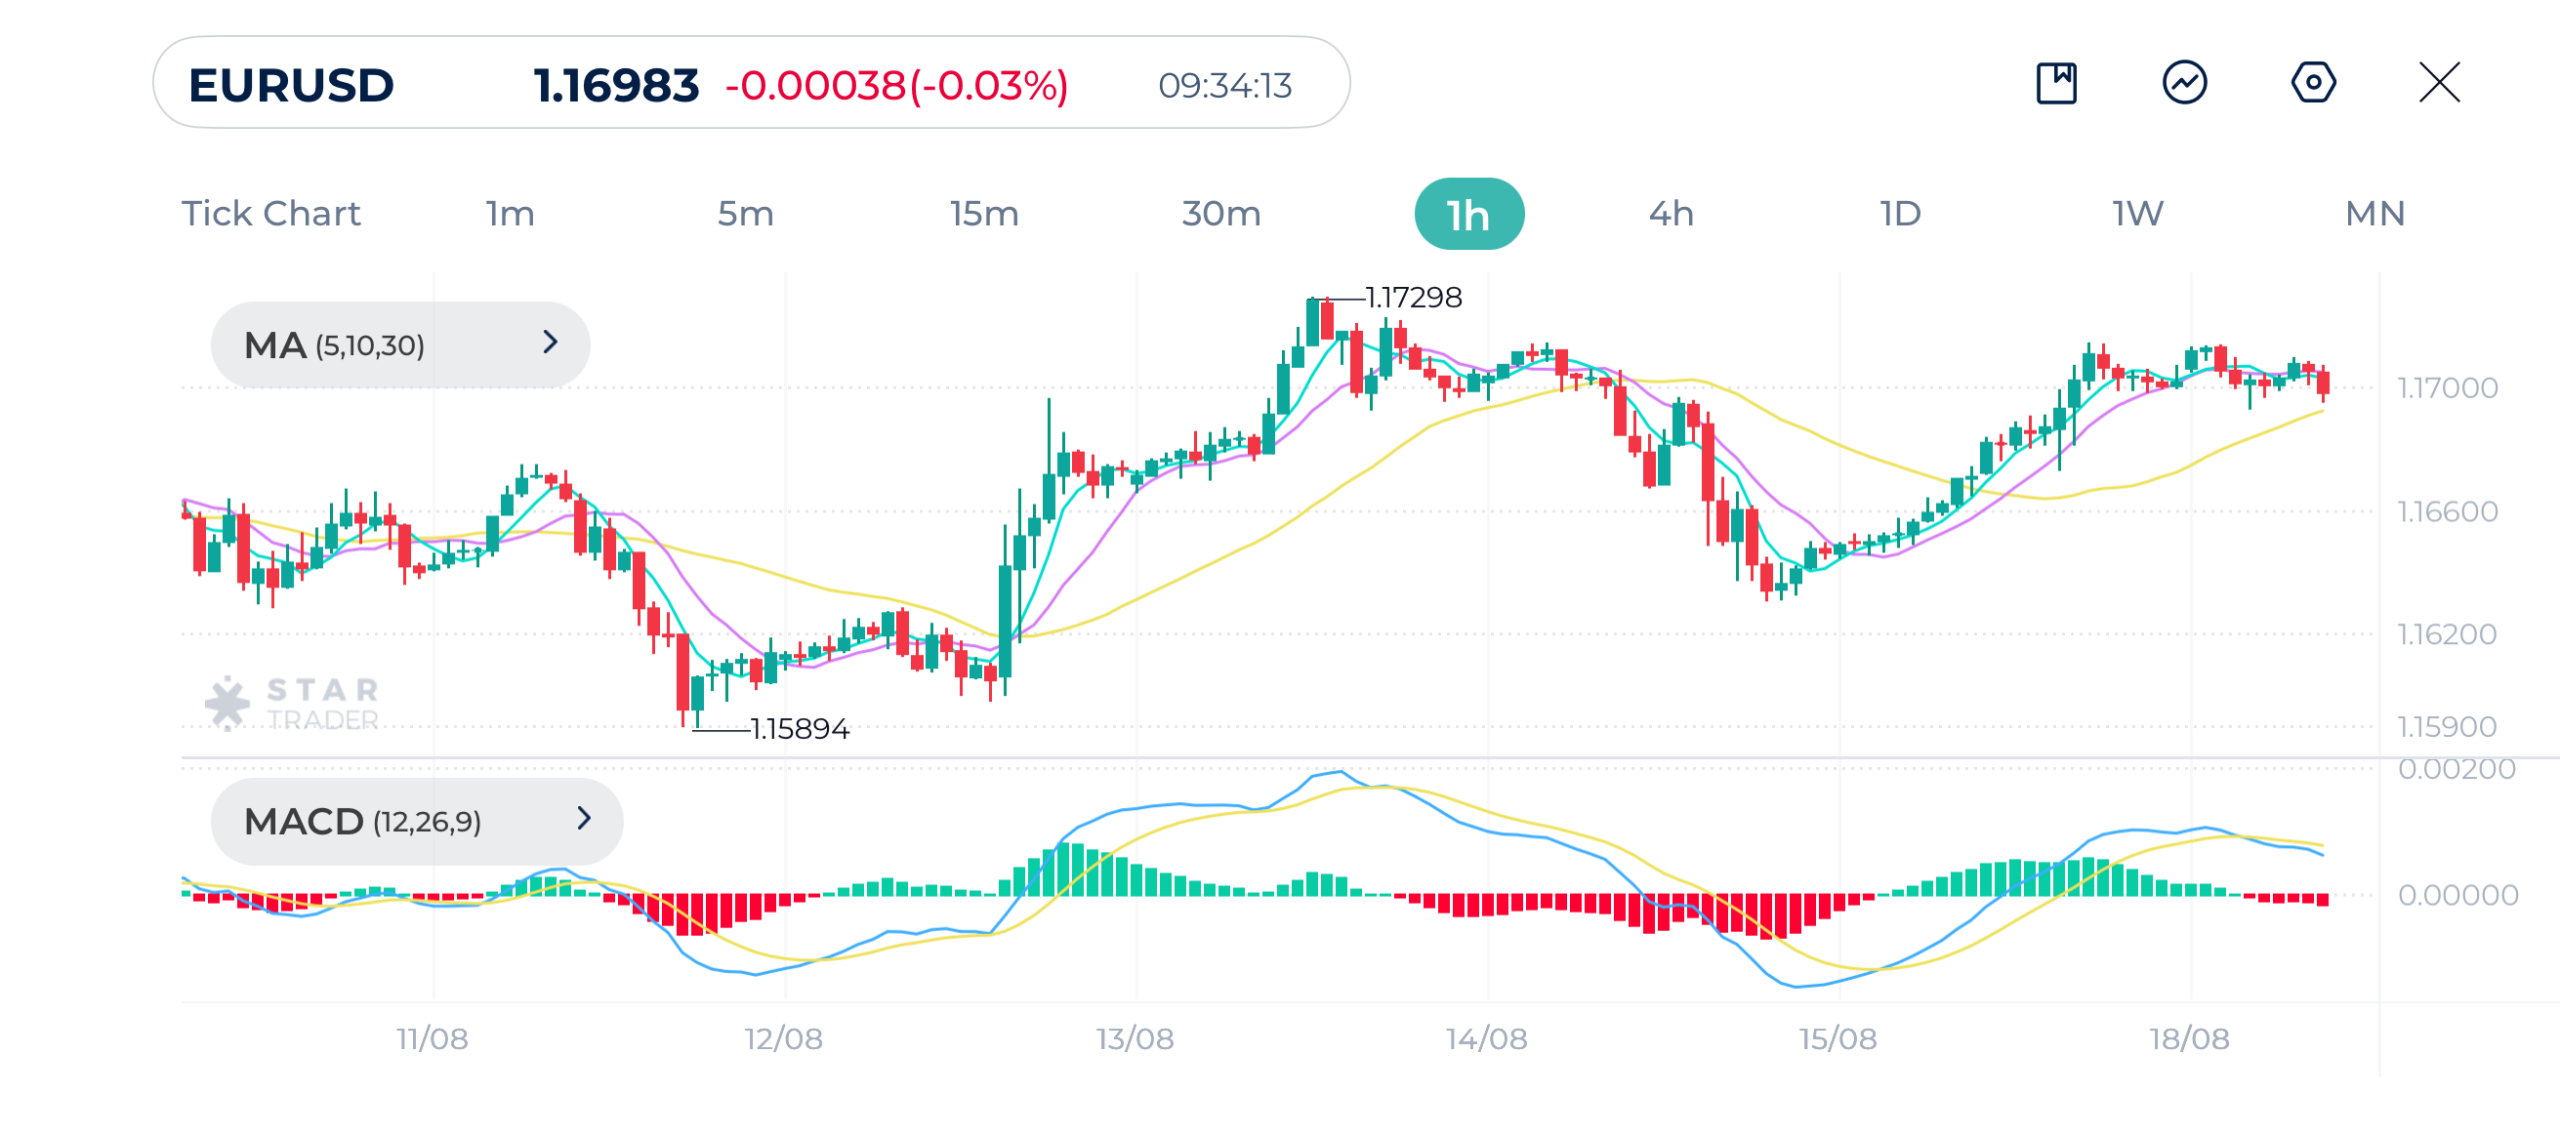
EURUSD is in an upward trend on the hourly chart with higher highs and higher lows. Moving averages have supported prices so far. The moving averages remain supportive of the trend, with prices staying above the 30-period moving average for the most part.
The MACD is neutral, with a flat histogram and converging lines, indicating the market is pausing rather than trending strongly. If EUR/USD holds above 1.1600, prices may reach 1.1830 again. A break below 1.1600 could shift momentum back to sellers and bring prices back to 1.1400
EURUSD 1H Chart
| Resistance | 1.1716 | 1.1735 | 1.1788 |
| Support | 1.1693 | 1.1673 | 1.1646 |
Dow Jones Technical Analysis
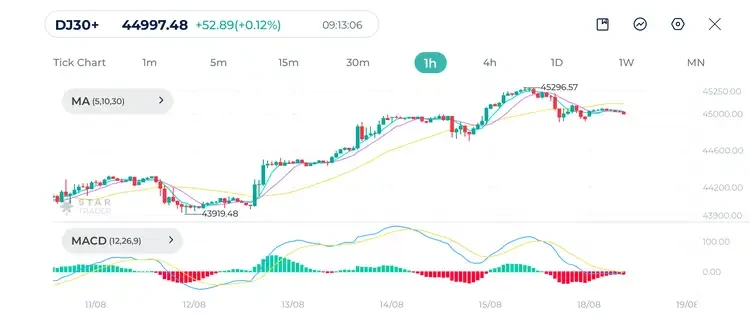
The Dow Jones is experiencing a minor bearish correction inside its uptrend on the hourly chart. The index is trading around 44,997 after peaking at around 45,296. The moving averages (MA 5, 10, 30) show a bearish crossover, which often signals a cooling in bullish momentum.
MACD is moving in negative territory, confirming weakening momentum.
This indicates that while the index has been in a strong uptrend since the 43,919 low, it is now consolidating and may either correct lower or range before resuming the upward trend. Falling below 44,600–44,700 support levels could price further down. While breaking above 45,300 resistance is a positive sign for price.
Dow Jones 1H Chart
| Resistance | 45,036 | 45,089 | 45,241 |
| Support | 44,900 | 44,836 | 44,676 |
Tags


Open Live Account
 Email Address
 Phone Number
Important Notice
STARTRADER does not accept any applications from Australian residents.
To comply with regulatory requirements, clicking the button will redirect you to the STARTRADER website operated by STARTRADER PRIME GLOBAL PTY LTD (ABN 65 156 005 668), an authorized Australian Financial Services Licence holder (AFSL no. 421210) regulated by the Australian Securities and Investments Commission.
Important Notice for Residents of the United Arab Emirates
In alignment with local regulatory requirements, individuals residing in the United Arab Emirates are requested to proceed via our dedicated regional platform at startrader.ae, which is operated by STARTRADER Global Financial Consultation & Financial Analysis L.L.C.. This entity is licensed by the UAE Capital Market Authority (CMA) under License No. 20200000241, and is authorised to introduce financial services and promote financial products in the UAE.
Please click the "Continue" button below to be redirected.


