


U.S. Dollar Index (USDX)
The dollar retreated on Thursday as market expectations mounted that the Federal Reserve would tone down its aggressive stance on interest rate hikes. Looking ahead to next week’s FOMC meeting, markets are expecting another 75-basis point hike, although sentiment is building that the Fed will opt for a smaller increase in December.
Housing data released this week, which showed that U.S. single-family home prices sank in August and sales of new U.S. single-family homes dropped in September, added to the case that the Fed’s aggressive tightening cycle is already working to slow the economy.
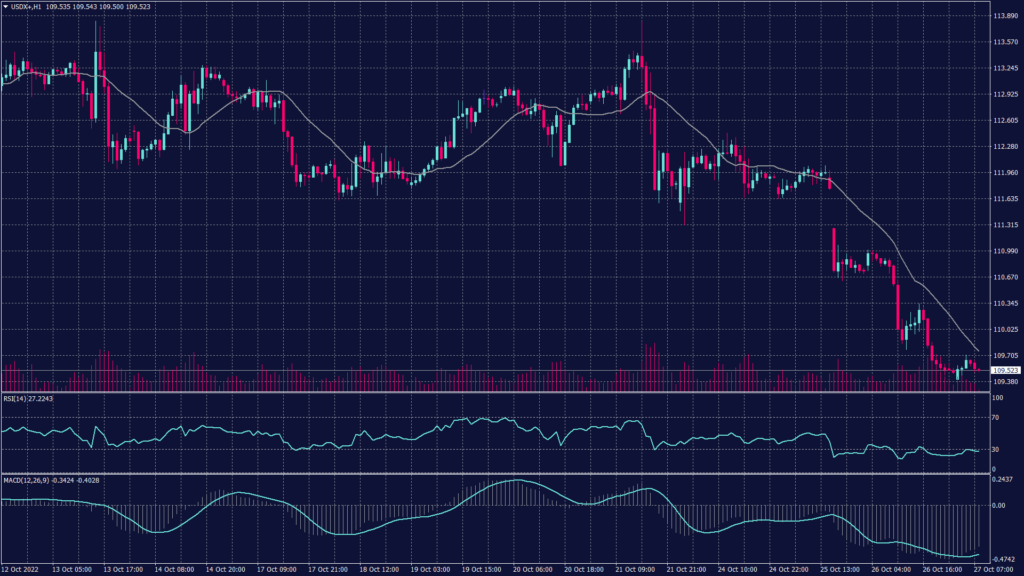
The dollar index drops below the major support level at 109.90 and is testing 109.40 for further decline. The hourly chart shows a high possibility of further decline which might result in a stronger correction toward 108.60. Additionally, breaking below 109.90 was the point to confirm the decline which is expected to remain until the FOMC meeting week.
On the daily chart, the index remains in the correction phase which might be considered a major change in direction if broke below 109.20. However, the technical indicators show a high probability of further decline which might result in a major drop toward 107.30.
Pivot Point: 109.40
| SUPPORT | RESISTANCE |
| 109.20 | 109.90 |
| 108.10 | 110.30 |
| 107.30 | 110.70 |
Sterling Pound (GBPUSD)
During the morning sessions, the British government delayed the announcement of its plan to repair the country’s financial situation, which supported the sterling pound. Furthermore, the delay was based on ensuring that the program reflected the latest and most accurate economic forecasts.
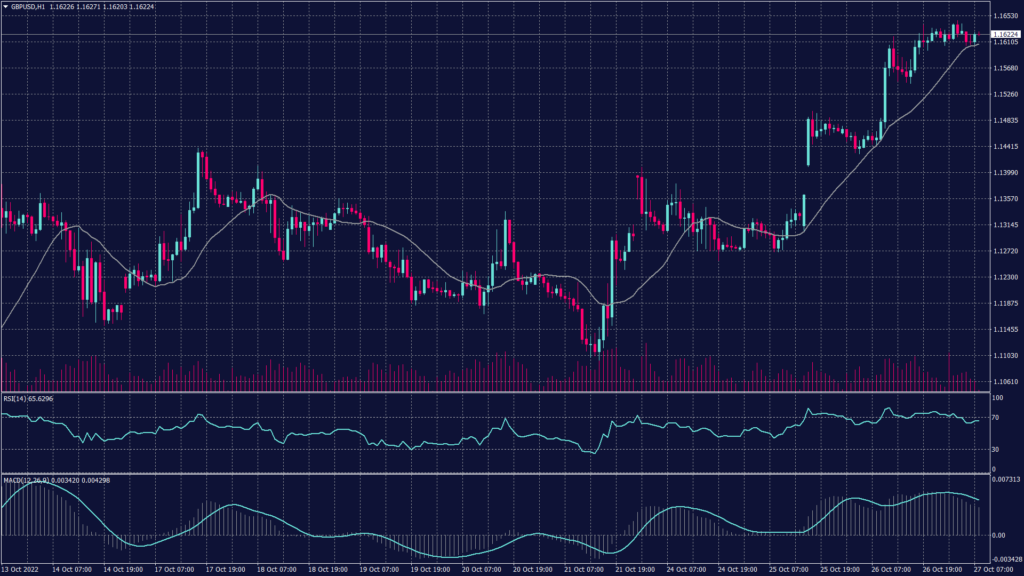
The Cable surged above the major resistance levels during the past 24 hours which provided momentum to test 1.1645 on the hourly chart. However, technical indicators show a high probability of penetrating the resistance at 1.1645 before a slowdown in the uptrend.
On the other hand, the daily chart shows a possibility to break above 1.1685 to target 1.1840. However, technical indicators confirm the assumption of further gains in the short run.
Pivot Point: 1.1620
| SUPPORT | RESISTANCE |
| 1.1645 | 1.1690 |
| 1.1685 | 1.1740 |
| 1.1840 | 1.1830 |
Australian Dollar (AUDUSD)
Data released on Wednesday showed that Australian inflation raced to a 32-year high last quarter, a shock result that stoked pressure for more aggressive rate hikes by the country’s central bank.
Westpac on Thursday said it had revised up its terminal rate expectation to 3.85% by March, from 3.6% previously, and expected the Reserve Bank of Australia to raise its cash rate by 50 bp in November.
Meanwhile, the Aussie was down 0.12% at $0.6487, paring some of its gains from a 1.6% overnight surge.
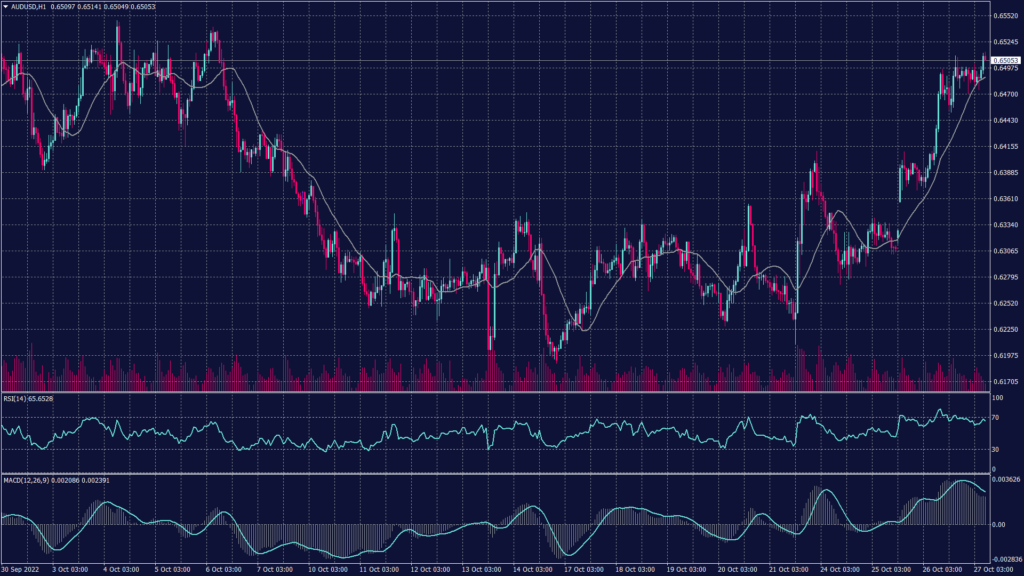
The Aussie succeeded to break above several resistance levels and reaching the major resistance at 0.6515. However, technical indicators on the hourly chart show a slowdown in the momentum which might not help to penetrate the major resistance.
Pivot Point: 0.6515
| SUPPORT | RESISTANCE |
| 0.6525 | 0.6540 |
| 0.6450 | 0.6630 |
| 0.6400 | 0.6720 |
Spot Gold (XAUUSD)
Gold prices traded near their highest level in two weeks on Thursday, with metal markets rallying as the dollar retreated on growing expectations that the Federal Reserve will soften its hawkish stance this year.
Spot gold rose 0.1% to $1,666.79 an ounce, briefly hitting an over-two-week high of $1,675.03, while gold futures traded at $1,670.80 an ounce, just below a two-week high. Bullion prices jumped nearly 1% on Wednesday and are now up for a third consecutive session. The gains now put the yellow metal within sight of its next major resistance at $1,700.
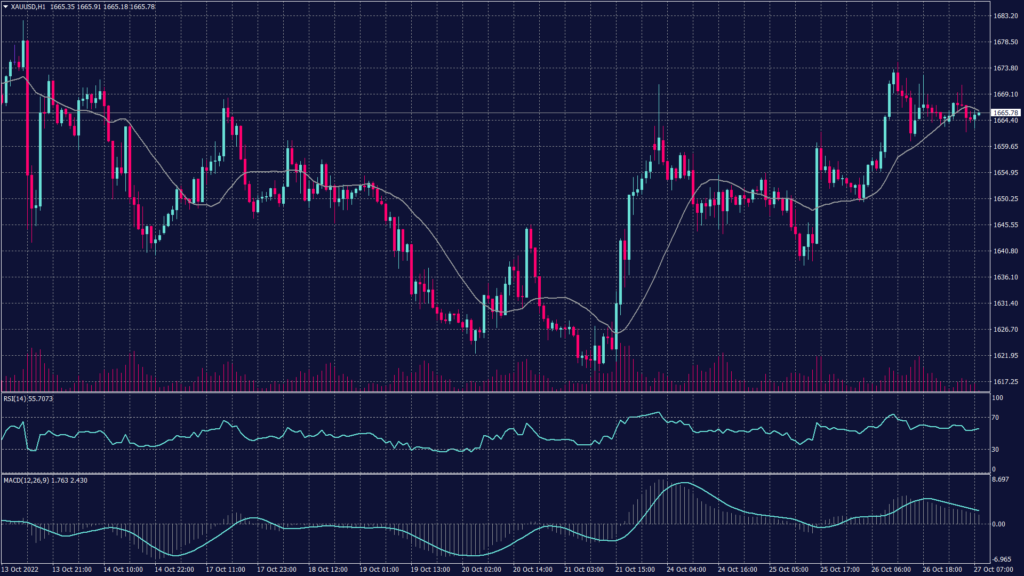
Gold prices remain positive to break above the resistance at 1,665 and target 1,670 on the hourly chart. Despite RSI’s signal showing a slowdown in momentum, MACD shows a possible continuation of the uptrend. Meanwhile, the daily chart remains within the downtrend channel heading towards 1,620 on the foreseen time frame.
Pivot Point: 1,668
| SUPPORT | RESISTANCE |
| 1,660 | 1,670 |
| 1,655 | 1,675 |
| 1,650 | 1,679 |
West Texas Crude (USOUSD)
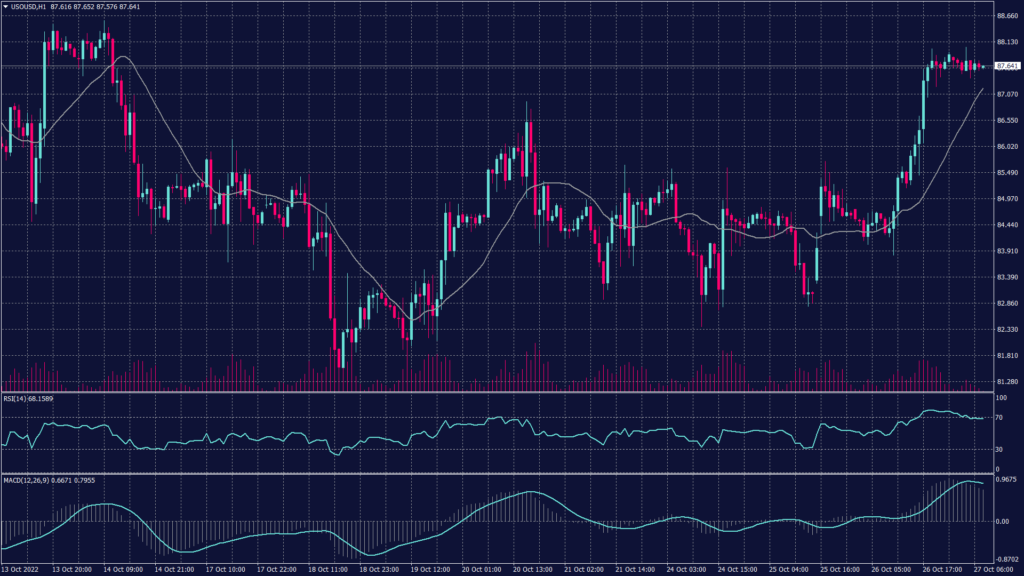
Oil prices hit a two-week high on Thursday as pressure from the dollar eased, while record-high U.S. crude exports suggested that global oil demand remained robust despite recent economic headwinds. On Thursday, Brent rose 0.3% to $94.08 a barrel, while West Texas Intermediate climbed 0.3% to $88.15 a barrel. Both contracts jumped between 2% and 4% on Wednesday and were trading at two-week highs.
Oil prices rose sharply from annual lows this month after OPEC and allies announced its largest supply cut since the COVID-19 pandemic in 2020. Additionally, the sanctions on Russian oil are expected to tighten supply towards the end of the year.
But the U.S. threatened to offset this tightening by releasing more oil from the SPR. The White House released about 3.4 million barrels of crude from the SPR last week, bringing the stockpile to its lowest level since 1984. However, Oil demand in the world’s largest importer, China, is also expected to remain weak in the coming months, given that the country has no plans to scale back its strict zero-COVID policy.
WTI prices gained drastically to hit the resistance at 87.95 which led to losing the momentum. Additionally, technical indicators show a high probability of a decline toward 84.30.
Pivot Point: 87.30
| SUPPORT | RESISTANCE |
| 85.50 | 87.95 |
| 84.90 | 88.70 |
| 84.30 | 89.95 |
Tags
Open Live Account
Please enter a valid country
No results found
No results found
Please enter a valid email
Please enter a valid verification code
1. 8-16 characters + numbers (0-9) 2. blend of letters (A-Z, a-z) 3. special characters (e.g, !a#S%^&)
Please enter the correct format
Please tick the checkbox to proceed
Please tick the checkbox to proceed
Important Notice
STARTRADER does not accept any applications from Australian residents.
To comply with regulatory requirements, clicking the button will redirect you to the STARTRADER website operated by STARTRADER PRIME GLOBAL PTY LTD (ABN 65 156 005 668), an authorized Australian Financial Services Licence holder (AFSL no. 421210) regulated by the Australian Securities and Investments Commission.
CONTINUEImportant Notice for Residents of the United Arab Emirates
In alignment with local regulatory requirements, individuals residing in the United Arab Emirates are requested to proceed via our dedicated regional platform at startrader.ae, which is operated by STARTRADER Global Financial Consultation & Financial Analysis L.L.C.. This entity is licensed by the UAE Capital Market Authority (CMA) under License No. 20200000241, and is authorised to introduce financial services and promote financial products in the UAE.
Please click the "Continue" button below to be redirected.
CONTINUEError! Please try again.

