


Markets are moving unchanged today waiting for the ECB meeting which is expected to result in a 75-basis points rate hike and pushing the common currency above the parity levels. Meanwhile, the U.S. dollar remains solid above 109.50 and the yellow metal penetrates above $1,723 per ounce.
U.S. Dollar Index (USDX)
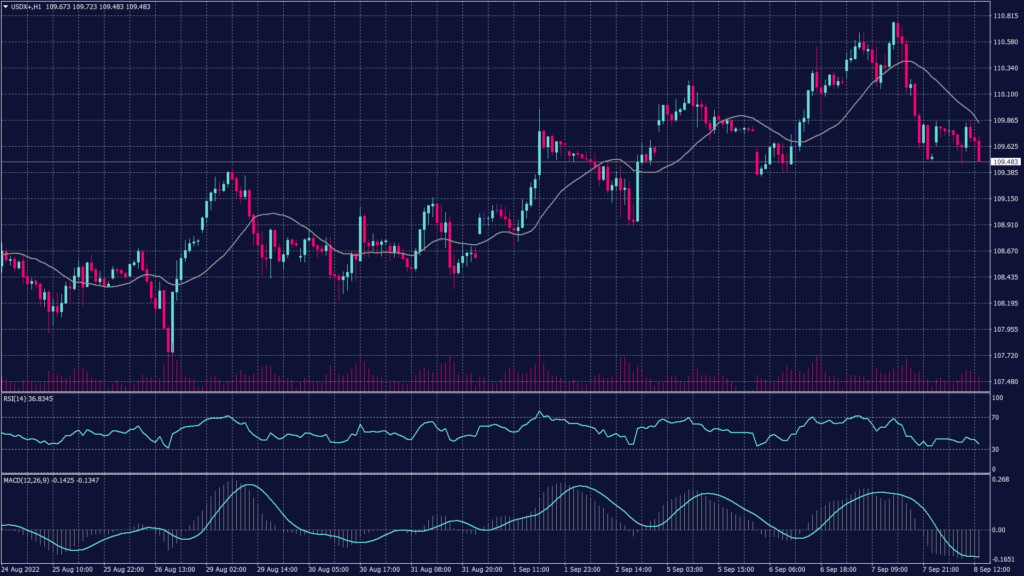
The Dollar Index traded 0.2% lower to 109.630, retreating from its 20 year low of 110.79. Attention will be on comments from Federal Reserve Chair Jerome Powell at a Cato Institute conference later in the session, with Fed officials soon due to enter into a blackout period before the U.S. central bank’s September 20-21 meeting.
Technically, the index remains strong despite the fluctuations in the uptrend. Technical indicators show a possibility of a slowdown but also show strong support above 110.25. RSI moves flat near 70 while the MACD remains on the top.
Pivot Point: 109.50
| SUPPORT | RESISTANCE |
| 109.25 | 109.90 |
| 109.10 | 110.20 |
| 108.95 | 110.50 |
Euro (EURUSD)
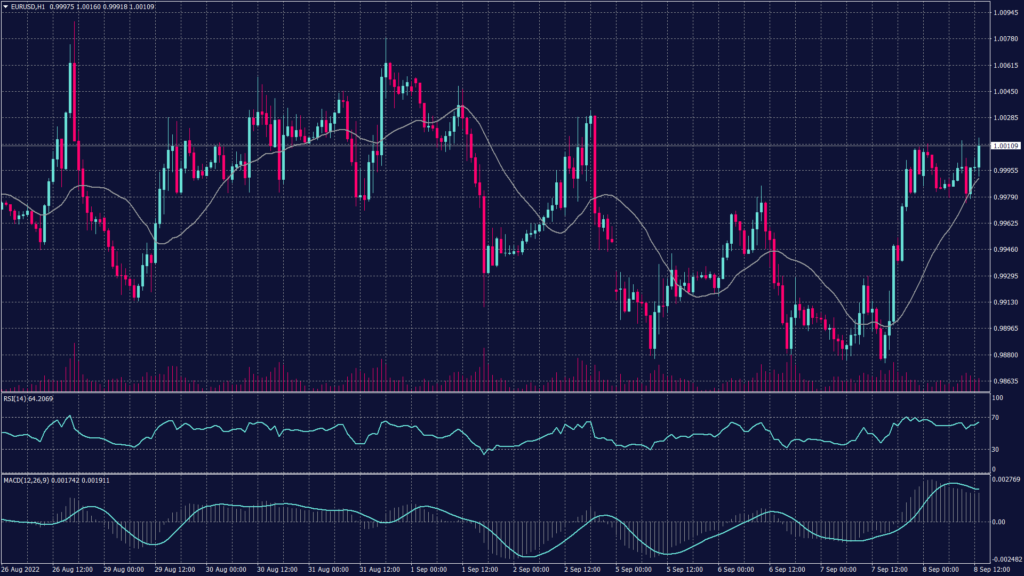
The EURUSD traded unchanged at 0.9996, climbing back towards parity after hitting a 20-year low of 0.9863 earlier in the week. The ECB is set to make its latest policy announcement, as is widely expected to raise rates significantly to fight runaway inflation, even as the risk of a Eurozone recession rises.
The debate is over the size of the hike, with consensus moving towards an increase of 75 basis points, following the lead of the U.S. Federal Reserve, with the central bank seen as having limited time to try and wrest back control over record inflation before growth in the region stalls.
The common currency remains weak and moving on the downtrend in the daily chart heading below 0.9850. Meanwhile, the hourly chart shows light support at 0.9870 which might not hold against the heavy bearish pressure.
Pivot Point: 0.9990
| SUPPORT | RESISTANCE |
| 0.9980 | 1.0050 |
| 0.9950 | 1.0080 |
| 0.9870 | 1.0100 |
Spot Gold (XAUUSD)
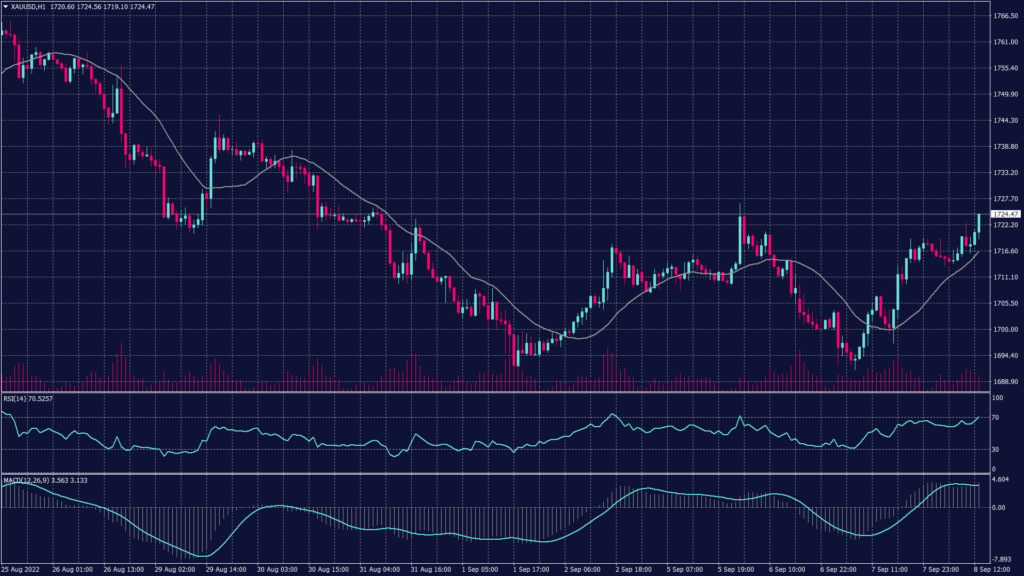
Spot gold is showing a double bottom formation on the hourly chart which yet to be confirmed on the daily chart. However, if gold prices penetrated the levels of 1,726 it will head to 1,740 which will be a possible platform for a new rise.
Pivot Point: 1,720
| SUPPORT | RESISTANCE |
| 1,710 | 1,737 |
| 1,705 | 1,740 |
| 1,680 | 1,742 |
West Texas Crude (USOUSD)
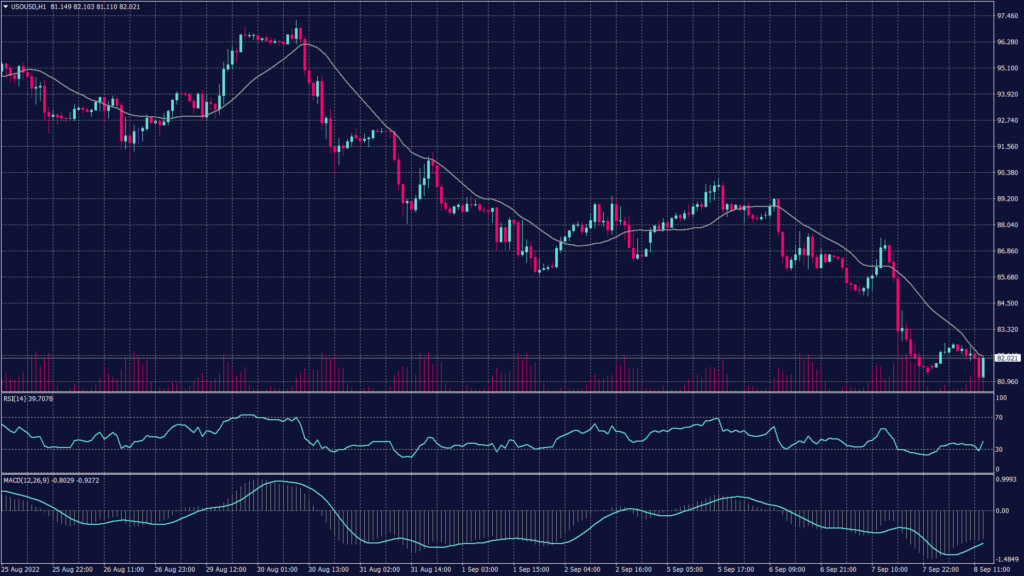
Oil prices fell to their lowest since before Russia invaded Ukraine as expectations of more interest rate hikes spurred worries of a global economic recession and lower fuel demand. Brent crude futures fell 1.5% to $91.48 a barrel while WTI futures shed 1.8% to $85.33.
Oil pared strong gains made on Monday after OPEC+ decided to cut output by 100,000 barrels per day in October. Additionally, crude inventories in the U.S. Strategic Petroleum Reserve (SPR) fell 7.5 million barrels in the week to September 2 to 442.5 million barrels, their lowest since November 1984.
Spot WTI traded lower breaking below the support at $86.70 per barrel and hitting the next support at $82.20 per barrel. The overall trend remains negative on the daily chart and signalling to break the support levels at $81.20 per barrel.
Pivot Point: 82.15
| SUPPORT | RESISTANCE |
| 81.20 | 86.90 |
| 77.50 | 89.70 |
| 71.70 | 91.20 |
Tags
Open Live Account
Please enter a valid country
No results found
No results found
Please enter a valid email
Please enter a valid verification code
1. 8-16 characters + numbers (0-9) 2. blend of letters (A-Z, a-z) 3. special characters (e.g, !a#S%^&)
Please enter the correct format
Please tick the checkbox to proceed
Please tick the checkbox to proceed
Important Notice
STARTRADER does not accept any applications from Australian residents.
To comply with regulatory requirements, clicking the button will redirect you to the STARTRADER website operated by STARTRADER PRIME GLOBAL PTY LTD (ABN 65 156 005 668), an authorized Australian Financial Services Licence holder (AFSL no. 421210) regulated by the Australian Securities and Investments Commission.
CONTINUEImportant Notice for Residents of the United Arab Emirates
In alignment with local regulatory requirements, individuals residing in the United Arab Emirates are requested to proceed via our dedicated regional platform at startrader.ae, which is operated by STARTRADER Global Financial Consultation & Financial Analysis L.L.C.. This entity is licensed by the UAE Capital Market Authority (CMA) under License No. 20200000241, and is authorised to introduce financial services and promote financial products in the UAE.
Please click the "Continue" button below to be redirected.
CONTINUEError! Please try again.

