


S&P500 Technical Analysis
The S&P 500 continues to trade in a strong uptrend, pushing to fresh highs near 6,940, supported by a series of higher highs and higher lows. Price is currently trading above the 30-period moving average, which is sloping upward and confirming trend strength. The shorter term moving averages MA(5) and MA(10) are aligned bullishly above the longer term MA(30), indicating persistent buying pressure.
MACD has crossed back into positive territory. This signals renewed bullish momentum, suggesting the market may attempt further upside continuation. A clean break above 6,950 would open the door for continuation toward higher psychological levels, while a move below the 30-period moving average would challenge the bullish structure.
S&P500 1H Chart
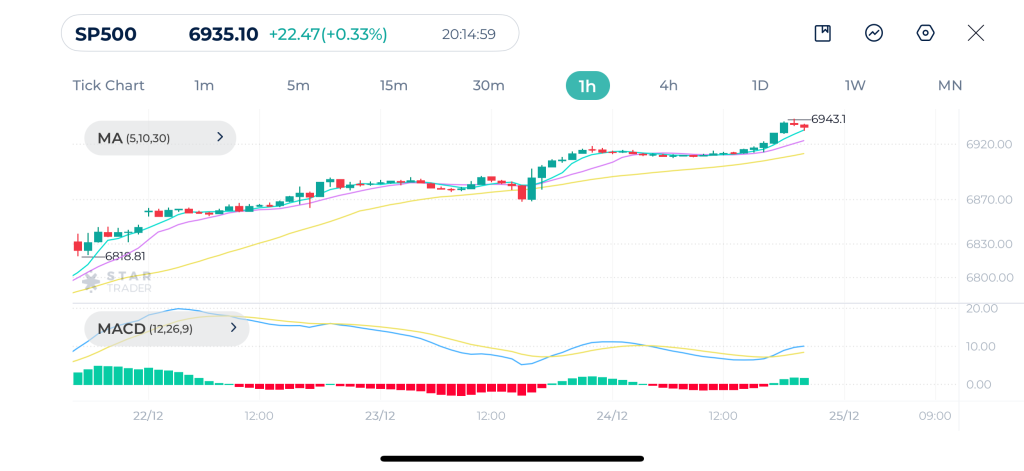
| Resistance | 6,937 | 6,950 | 6,975 |
| Support | 6,922 | 6,909 | 6,900 |
USDCHF Technical Analysis
USDCHF continues to trade in a bearish structure. The pair is trading below the 30-period moving average, which is sloping downward and acting as dynamic resistance. The shorter moving averages MA(5) and MA(10) remain below the 30-period moving average, reinforcing the bearish bias, although price is attempting a modest rebound from the 0.7860 support zone.
As long as price remains below 0.7,900–0.7,920, the broader bias stays bearish, and any upside is likely corrective. A break above the 30-period moving average would be needed to confirm a more meaningful trend shift.
USDCHF 1H Chart
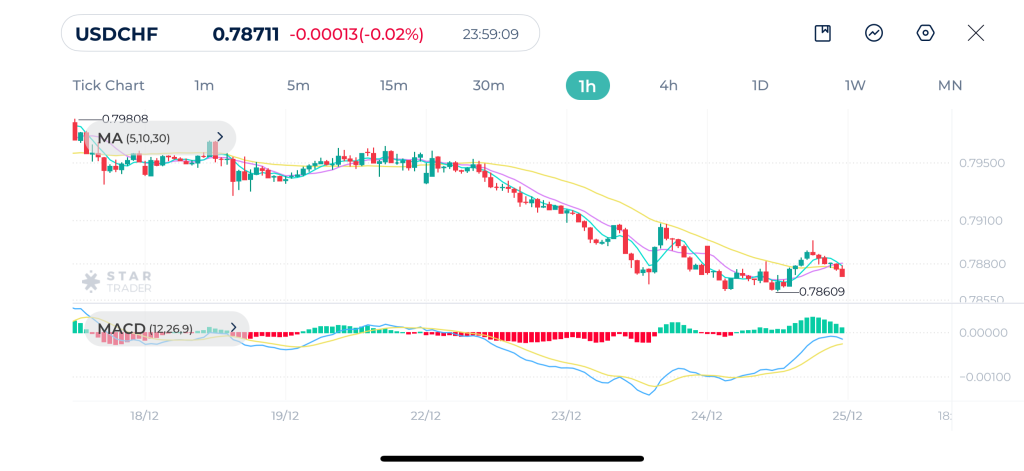
| Resistance | 0.7896 | 0.7908 | 0.7916 |
| Support | 0.7875 | 0.7861 | 0.7842 |
Brent Technical Analysis
Brent oil remains in a short-term bullish phase, with price now consolidating around $62.30–$62.70. The overall structure is clearly defined by higher highs and higher lows, and price continues to trade above the 30-period moving average, which is rising and acting as dynamic support.
MACD remains above the zero line, confirming bullish trend conditions. As long as price holds above the $61.80–$61.50 support zone, the bullish bias remains intact, with potential for another upside attempt toward $63.00–$63.50. A sustained break below the 30-period moving average would be the first signal of deeper corrective risk.
Brent 1H Chart
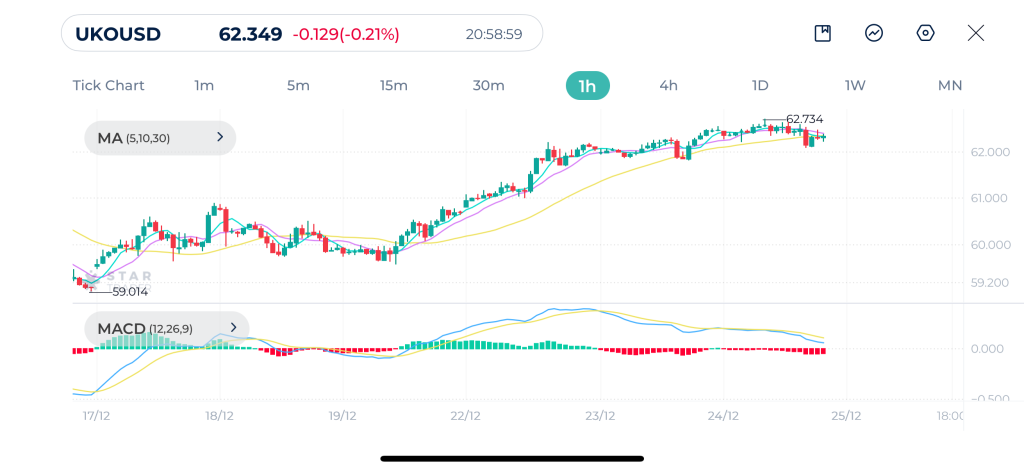
| Resistance | $62.04 | $62.25 | $62.63 |
| Support | $61.51 | $61.14 | $60.84 |
Tags
Open Live Account
Please enter a valid country
No results found
No results found
Please enter a valid email
Please enter a valid verification code
1. 8-16 characters + numbers (0-9) 2. blend of letters (A-Z, a-z) 3. special characters (e.g, !a#S%^&)
Please enter the correct format
Please tick the checkbox to proceed
Please tick the checkbox to proceed
Important Notice
STARTRADER does not accept any applications from Australian residents.
To comply with regulatory requirements, clicking the button will redirect you to the STARTRADER website operated by STARTRADER PRIME GLOBAL PTY LTD (ABN 65 156 005 668), an authorized Australian Financial Services Licence holder (AFSL no. 421210) regulated by the Australian Securities and Investments Commission.
CONTINUEImportant Notice for Residents of the United Arab Emirates
In alignment with local regulatory requirements, individuals residing in the United Arab Emirates are requested to proceed via our dedicated regional platform at startrader.ae, which is operated by STARTRADER Global Financial Consultation & Financial Analysis L.L.C.. This entity is licensed by the UAE Capital Market Authority (CMA) under License No. 20200000241, and is authorised to introduce financial services and promote financial products in the UAE.
Please click the "Continue" button below to be redirected.
CONTINUEError! Please try again.

