


Bank of England Chief Economist Huw Pill said overnight that the central bank is likely to deliver a “significant policy response” in response to finance minister Kwasi Kwarteng’s huge tax cut plans. Meanwhile, the sterling is getting closer to the parity levels with only 700 pips distance.
U.S. Dollar Index (USDX)
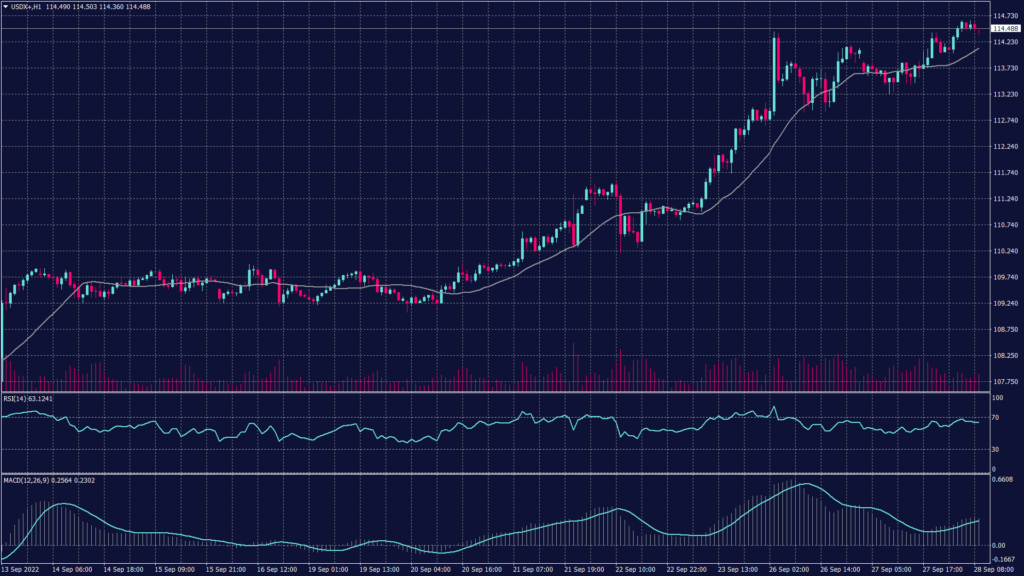
Markets forced the dollar to a fresh two-decade peak on Wednesday as rising global interest rates fed recession worries, while sterling languished near all-time lows on fears over Britain’s radical tax cut plans. The U.S. dollar index rose about 0.5% to hit a new high of 114.70 in Asia trade. Meanwhile, the relentless upward rally of the dollar came as benchmark U.S. 10-year Treasury yields rose to 4% for the first time since 2010, topping at 4.004%. The two-year yields stood at 4.2891%.
Technically, the index remains positive on both the daily and hourly charts after exceeding the 114 level. However, the hourly chart shows support above 114.20 and strong resistance at 114.80. Meanwhile, the daily chart shows no strong resistance below 115.30. On the other hand, technical indicators show a possible continuation of the uptrend on MACD figures and a horizontal trend signal on the RSI.
Pivot Point: 114.30
| SUPPORT | RESISTANCE |
| 113.70 | 114.70 |
| 113.40 | 115.30 |
| 113.00 | 115.80 |
Sterling Pound (GBPUSD)
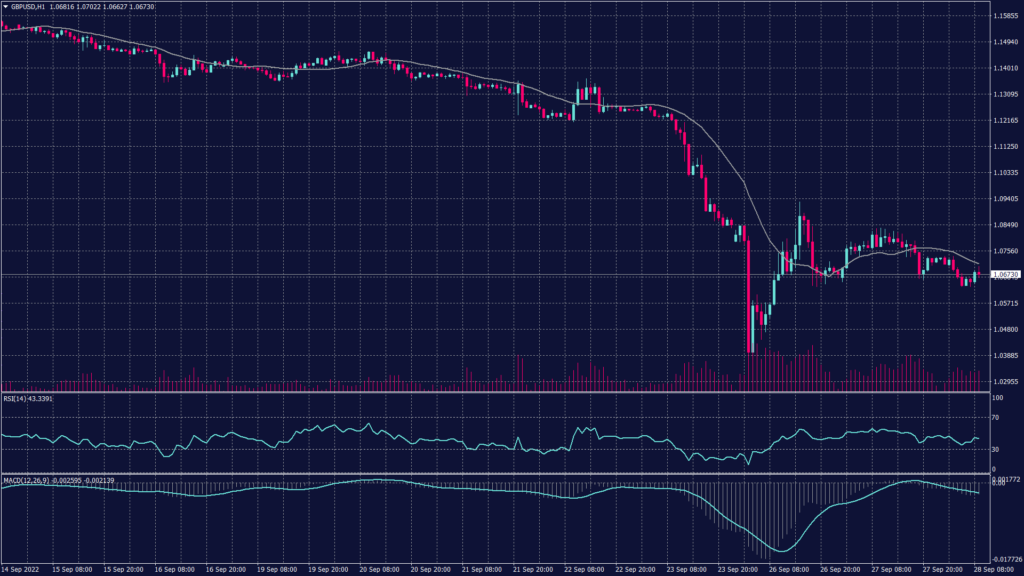
Sterling shed 0.95% to $1.06345, reversing a marginal 0.4% gain in the previous session. It is still holding deep losses after collapsing to an all-time low of $1.0327 at the start of the week, having held near the $1.1300 level before last week’s UK budget.
Technically, the cable remains negative below the level of 1.0830 despite the correction from 1.0290 and signals a possible decline from 1.0830. The technical indicators show a slowdown in the downtrend while remaining far from changing the direction. Meanwhile, the daily chart is also negative and MACD is showing a possibility of further decline towards the parity levels.
Pivot Point: 1.0775
| SUPPORT | RESISTANCE |
| 1.0700 | 1.0830 |
| 1.0610 | 1.0950 |
| 1.0415 | 1.1110 |
Spot Gold (XAUUSD)
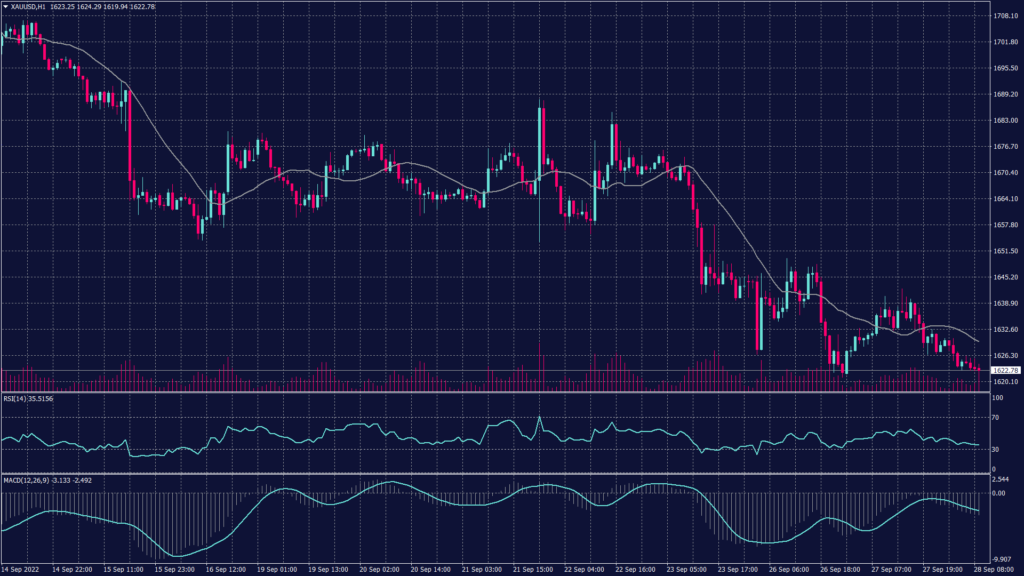
Technically, the precious metal remains under selling pressure below $1,650 per ounce on the hourly chart. However, technical indicators show a possibility of fluctuation and a slight rebound to 1,650 during the European session.
Pivot Point: 1,620
| SUPPORT | RESISTANCE |
| 1,615 | 1,630 |
| 1,610 | 1,638 |
| 1,600 | 1,646 |
West Texas Crude (USOUSD)
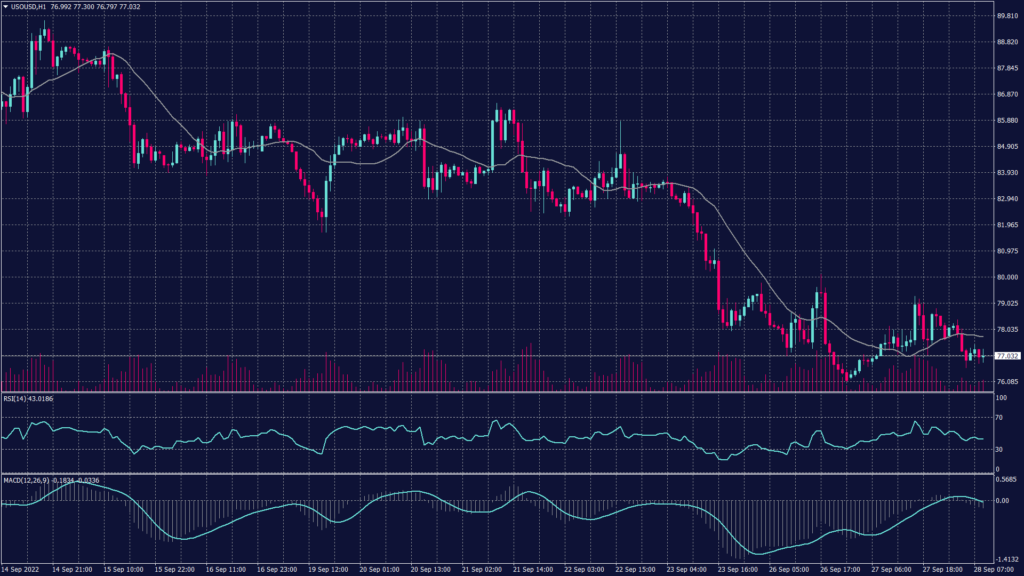
Oil prices fell more than 1% on Wednesday, pressured by a strengthening dollar and crude storage builds that offset support from U.S. production cuts caused by Hurricane Ian.
Data from the American Petroleum Institute, released late Tuesday, showed U.S. crude stockpiles rose by much more than expected last week, up 4 million barrels, raising concerns of slowing demand at the world’s largest consumer. Brent crude futures fell 1.2% to $85.25 per barrel, while WTI crude was down 1.2% at $77.53 per barrel.
Pivot Point: 78.00
| SUPPORT | RESISTANCE |
| 77.10 | 80.10 |
| 68.00 | 81.60 |
| 67.60 | 83.30 |
Tags
Open Live Account
Please enter a valid country
No results found
No results found
Please enter a valid email
Please enter a valid verification code
1. 8-16 characters + numbers (0-9) 2. blend of letters (A-Z, a-z) 3. special characters (e.g, !a#S%^&)
Please enter the correct format
Please tick the checkbox to proceed
Please tick the checkbox to proceed
Important Notice
STARTRADER does not accept any applications from Australian residents.
To comply with regulatory requirements, clicking the button will redirect you to the STARTRADER website operated by STARTRADER PRIME GLOBAL PTY LTD (ABN 65 156 005 668), an authorized Australian Financial Services Licence holder (AFSL no. 421210) regulated by the Australian Securities and Investments Commission.
CONTINUEImportant Notice for Residents of the United Arab Emirates
In alignment with local regulatory requirements, individuals residing in the United Arab Emirates are requested to proceed via our dedicated regional platform at startrader.ae, which is operated by STARTRADER Global Financial Consultation & Financial Analysis L.L.C.. This entity is licensed by the UAE Capital Market Authority (CMA) under License No. 20200000241, and is authorised to introduce financial services and promote financial products in the UAE.
Please click the "Continue" button below to be redirected.
CONTINUEError! Please try again.

