








 Web Trader MT5












Gold Technical Analysis
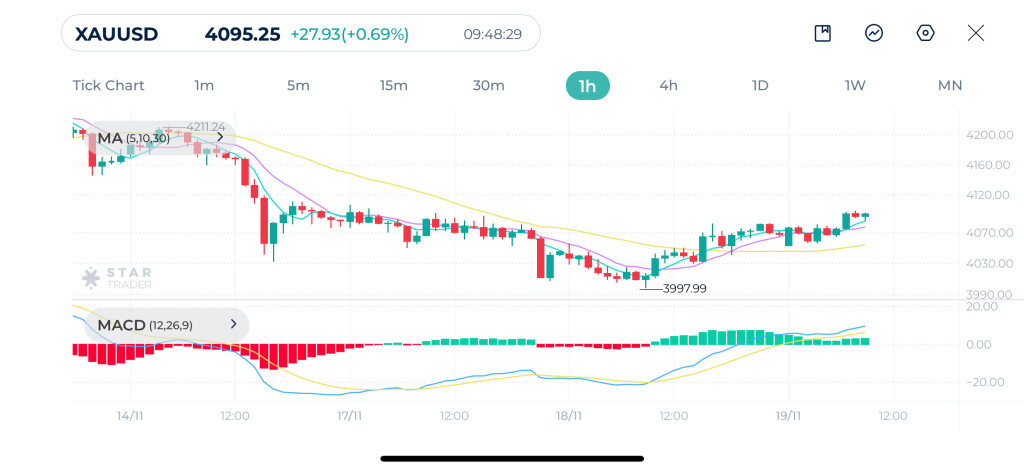
Gold has started to show signs of stabilizing after a prolonged decline, with the recent low around $4,000 acting as a strong support level where buyers stepped back into the market. Price action has since shifted into a mild recovery, with gold now trading above the fast moving averages MA(5 and 10), while attempting to break through the 30-MA, which remains a key barrier separating the trend from a true reversal. The bullish candles forming over the past several hours indicate controlled buying interest, likely driven by oversold conditions and a temporary reduction in panic selling.
MACD reinforces this transition as the histogram prints consecutive green bars and the MACD line rises firmly above the signal line, signaling that bullish momentum is gaining strength. Despite this, the broader trend still carries a bearish tone because the market has not yet broken out of its descending structure.
For gold to confirm a stronger move upward, it needs to push convincingly above $4,110 – $4,130, an area where sellers previously dominated. If buyers fail to maintain current momentum, gold risks slipping back toward the psychological 4,000 level. Overall, XAUUSD is in the early stages of a recovery, but it needs a breakout above the 30-MA and key resistance to signal a genuine trend reversal.
Gold 1H Chart
| Resistance | $4,100 | $4,145 | $4,200 |
| Support | $4,055 | $4,029 | $4,000 |
Bitcoin Technical Analysis
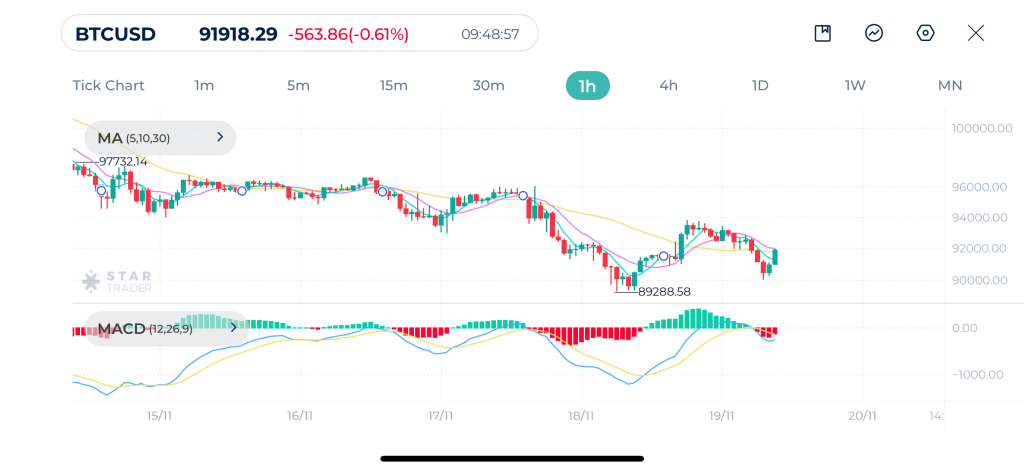
Bitcoin continues to trade in a clear short-term downtrend, with price consistently moving below all three moving averages (5, 10, 30). The recent dip toward $89,288 marked a local capitulation point, where buyers finally stepped in and formed a temporary rebound
However, the structure remains bearish because the recovery candle, although strong, has not yet pushed above the declining 30-period moving average , keeping downward pressure intact.
For the bullish scenario to strengthen, Bitcoin must break above the cluster of resistance around $92,500 – $93,000. Until that happens, rallies are more likely to be sold into, especially given the persistent sequence of lower highs forming since mid-November. If the bounce fails, the market could retest the key support at $89,300, and a loss of that area may open the door toward deeper downside levels. Overall, the market remains bearish but shows early signs of a corrective pullback unfolding.
Bitcoin 1H Chart
| Resistance | $93,707 | $95,977 | $97,428 |
| Support | $90,041 | $89,300 | $87,600 |
EURUSD Technical Analysis
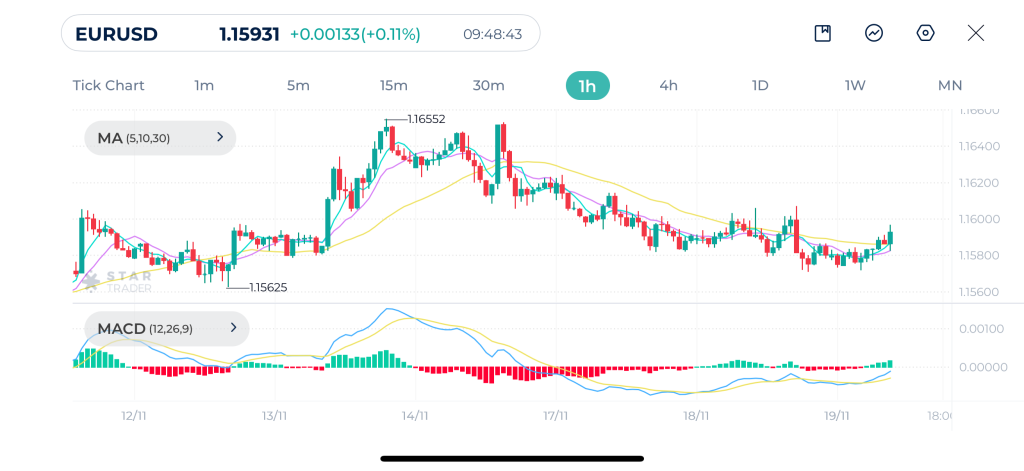
EURUSD is stabilizing after several days of gradual downside movement, with price attempting to regain upward momentum from the 1.1580 – 1.1600 region. The pair recently bounced off minor support near 1.15625, which has acted as a short-term floor multiple times. However, the overall structure still leans mildly bearish because the pair has not been able to break above the descending 30-MA, which continues to act as dynamic resistance. The bounce visible in the latest candles reflects early buying interest, but it remains within a consolidative environment characterized by choppy price action and fading volatility.
MACD supports the idea of a building bullish correction as the MACD line crosses above the signal line from oversold conditions. This suggests momentum is shifting, but directional conviction is still weak. A decisive break above 1.1605 – 1.1620 would be required to confirm a stronger intraday recovery, potentially opening the way toward the previous swing high at 1.1655. Failure to sustain above 1.1600, however, would keep EURUSD vulnerable to a renewed drop back toward 1.1570 and potentially the deeper support zone at 1.1550. For now, the pair is trying to build a base, but buyers still need confirmation to regain control.
EURUSD 1H Chart
| Resistance | 1.1608 | 1.1635 | 1.1705 |
| Support | 1.1571 | 1.1549 | 1.1470 |
Tags


Open Live Account
 Email Address
 Phone Number
Important Notice
STARTRADER does not accept any applications from Australian residents.
To comply with regulatory requirements, clicking the button will redirect you to the STARTRADER website operated by STARTRADER PRIME GLOBAL PTY LTD (ABN 65 156 005 668), an authorized Australian Financial Services Licence holder (AFSL no. 421210) regulated by the Australian Securities and Investments Commission.
Important Notice for Residents of the United Arab Emirates
In alignment with local regulatory requirements, individuals residing in the United Arab Emirates are requested to proceed via our dedicated regional platform at startrader.ae, which is operated by STARTRADER Global Financial Consultation & Financial Analysis L.L.C.. This entity is licensed by the UAE Capital Market Authority (CMA) under License No. 20200000241, and is authorised to introduce financial services and promote financial products in the UAE.
Please click the "Continue" button below to be redirected.


