


Demand for conventional safe havens rose after Russia shut a major gas pipeline to Europe, putting the continent at risk of a major energy crisis. Focus is now on a European Central Bank meeting later in the week, where market participants expect the bank to begin raising interest rates.
U.S. Dollar Index (USDX)
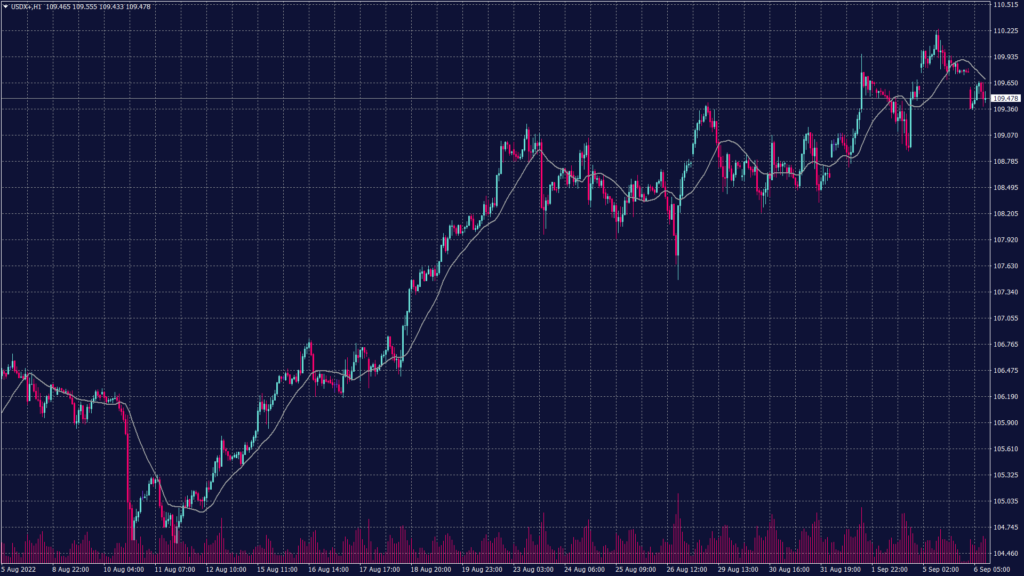
the U.S. dollar index rally appears to have paused, as market participants await more details on the path of U.S. monetary policy. However, expectations of more interest rate hikes by the Federal Reserve kept the dollar underpinned around 20-year highs. Rising interest rates have weighed heavily on gold prices this year, as traders sought better yields from the dollar and Treasuries. The Fed is also broadly expected to maintain its pace of rate hikes this month.
The overall trend remains positive heading to exceeding the current high levels. However, the momentum slowed which might lead prices to decline below 109.70. Bollinger bands show resistance at 110.40 and possible support at 109.35.
Pivot Point: 109.50
| SUPPORT | RESISTANCE |
| 109.40 | 110.00 |
| 109.30 | 110.20 |
| 109.30 | 110.40 |
Euro (EURUSD)
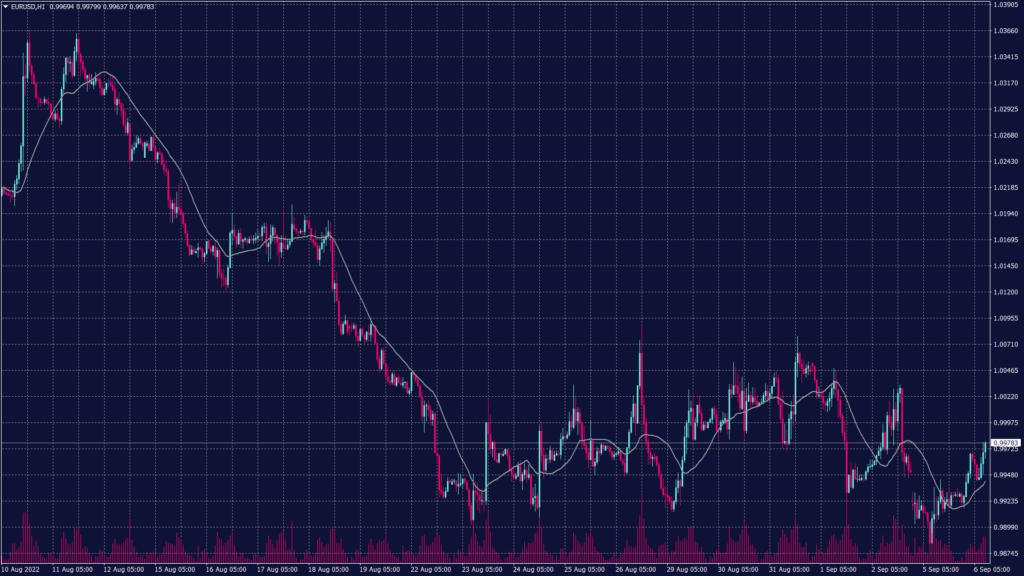
Demand for conventional safe havens rose after Russia shut a major gas pipeline to Europe, putting the continent at risk of a major energy crisis. The euro slumped to new 20-year lows this week, given that the crisis is expected to severely impact economic growth in the eurozone. Focus is now on a European Central Bank meeting later in the week, where market participants expect the bank to begin raising interest rates.
Technically, the pair remains under selling pressure below the parity levels towards new lows. Technical indicators signal a possibility of further decline towards 0.9810. Meanwhile, Fibonacci retracement shows resistance at 0.9975 and 0.9985 on the hourly chart indicating a possible decline.
Pivot Point: 0.9920
| SUPPORT | RESISTANCE |
| 0.9910 | 0.9940 |
| 0.9870 | 0.9970 |
| 0.9810 | 1.0005 |
Spot Gold (XAUUSD)
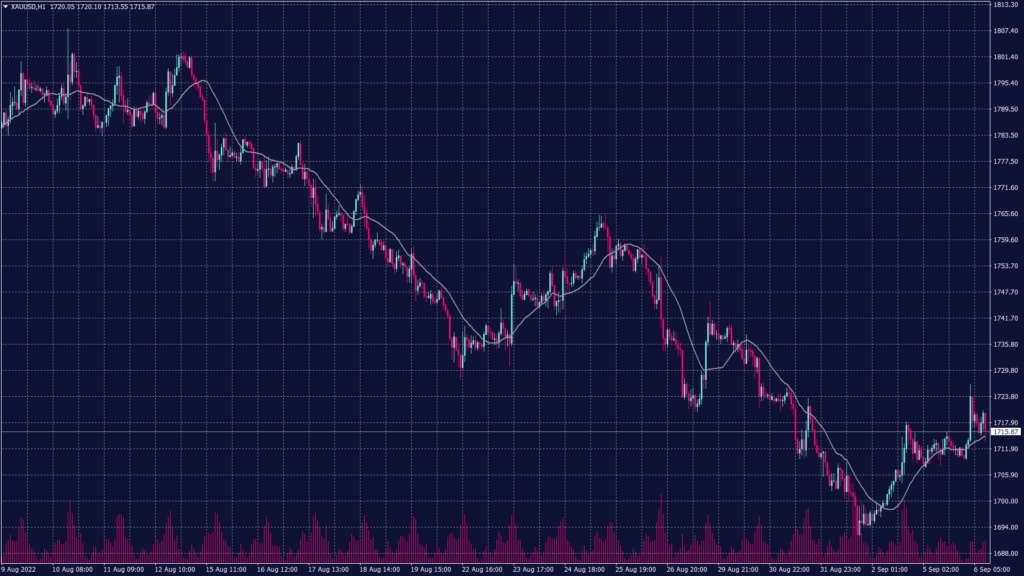
Gold prices recovered sharply from a six-week low on Tuesday as a worsening energy crisis in Europe drove up safe-haven demand, while copper extended gains on expectations of more Chinese stimulus measures. Spot gold jumped 0.5% to $1,718.95 an ounce, while gold futures were up 0.5% at $1,730.0.
The yellow metal trend remains negative after finding the resistance between 1,705 and 1,710 on the hourly chart. Technical indicators show a possibility of a horizontal movement between 1,700 and 1,710 before breaking into new short-term lows.
Pivot Point: 1,715
| SUPPORT | RESISTANCE |
| 1,700 | 1,720 |
| 1,685 | 1,726 |
| 1,680 | 1,740 |
West Texas Crude (USOUSD)
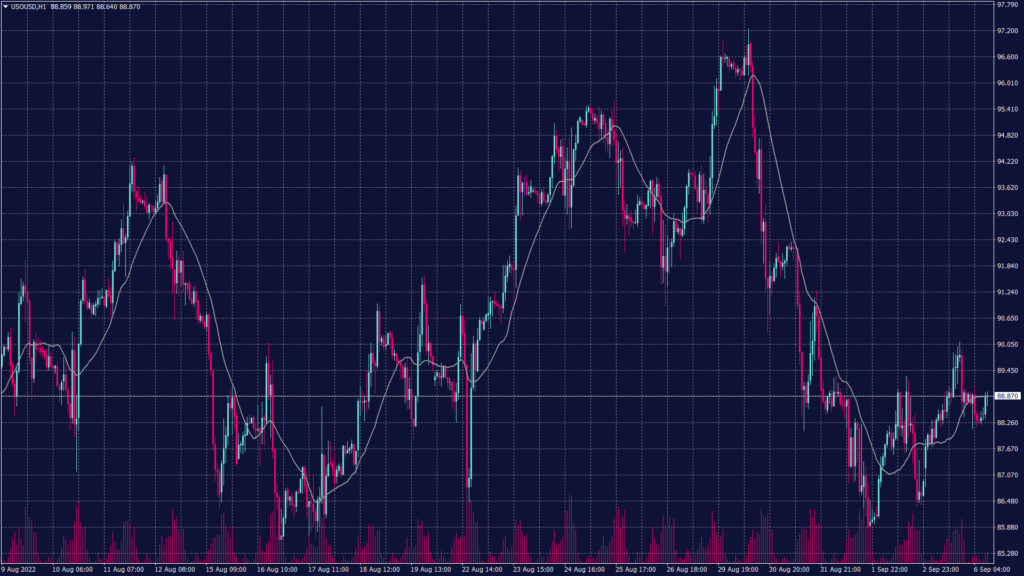
Both WTI and Brent crudes swung on Tuesday after the OPEC+ said it will trim production levels to offset a drop in prices amid fears of slowing demand and economic growth. Brent Oil Futures fell 0.1% to $95.12 a barrel, while U.S. West Texas Intermediate futures jumped 2.2% to $88.75 a barrel.
However, OPEC+ agreed during the meeting on Monday that it will cut output by 100,000 barrels per day (bpd) for October – roughly 0.1% of global demand.
Technically, WTI prices continue to decline to $86 per barrel after breaking the support at $88.25. technical indicators show the downtrend slowing down without any signs of a rebound.
Pivot Point: 88.50
| SUPPORT | RESISTANCE |
| 86.90 | 89.30 |
| 86.15 | 90.10 |
| 85.00 | 90.90 |
Tags
Open Live Account
Please enter a valid country
No results found
No results found
Please enter a valid email
Please enter a valid verification code
1. 8-16 characters + numbers (0-9) 2. blend of letters (A-Z, a-z) 3. special characters (e.g, !a#S%^&)
Please enter the correct format
Please tick the checkbox to proceed
Please tick the checkbox to proceed
Important Notice
STARTRADER does not accept any applications from Australian residents.
To comply with regulatory requirements, clicking the button will redirect you to the STARTRADER website operated by STARTRADER PRIME GLOBAL PTY LTD (ABN 65 156 005 668), an authorized Australian Financial Services Licence holder (AFSL no. 421210) regulated by the Australian Securities and Investments Commission.
CONTINUEImportant Notice for Residents of the United Arab Emirates
In alignment with local regulatory requirements, individuals residing in the United Arab Emirates are requested to proceed via our dedicated regional platform at startrader.ae, which is operated by STARTRADER Global Financial Consultation & Financial Analysis L.L.C.. This entity is licensed by the UAE Capital Market Authority (CMA) under License No. 20200000241, and is authorised to introduce financial services and promote financial products in the UAE.
Please click the "Continue" button below to be redirected.
CONTINUEError! Please try again.

