


Gold Technical Analysis
Gold is trading near $4,630 after a sharp selloff from the $4,700 region. Price broke below multiple support levels and is now trading beneath all key moving averages: MA5, MA10, and MA20. This bearish alignment confirms strong downside pressure.
Unless gold reclaims $4,655–$4,670, sellers remain in control. A break below $4,623 would likely extend losses toward $4,612 and $4,600.
Volume increased into the decline, confirming bearish conviction.
Bias remains bearish below $4,655, with downside pressure dominant unless a sharp recovery reclaims the moving averages.
Gold 1H Chart
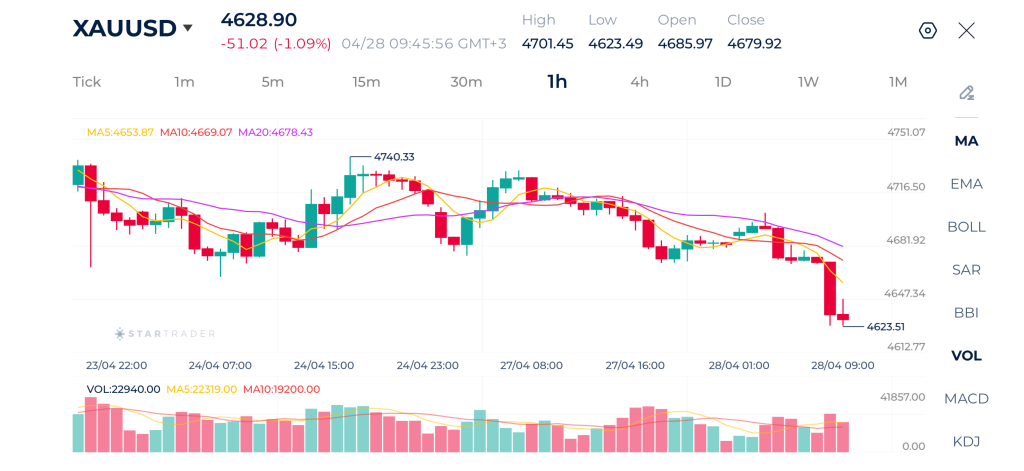
| Resistance | $4,669 | $4,700 | $4,750 |
| Support | $4,612 | $4,580 | $4,526 |
Brent Technical Analysis
Brent crude is trading near $109.71 after extending its rally and printing a fresh high at $110.32. Price action remains decisively bullish, with consistent higher highs and higher lows. The market is trading above all major moving averages: MA5, MA10, and MA20, confirming strong upward momentum.
The alignment of short-term averages above longer-term averages reflects trend acceleration, while shallow pullbacks suggest buyers remain in control.
As long as price holds above $108.70, bulls retain momentum. A break above $110.32 could open the door toward $111.10 and beyond.
Momentum remains strong, although volume is moderate rather than explosive. This suggests a healthy trend continuation rather than panic buying.
Bias remains bullish above $108.70, targeting $111.10 next.
Brent 1H Chart
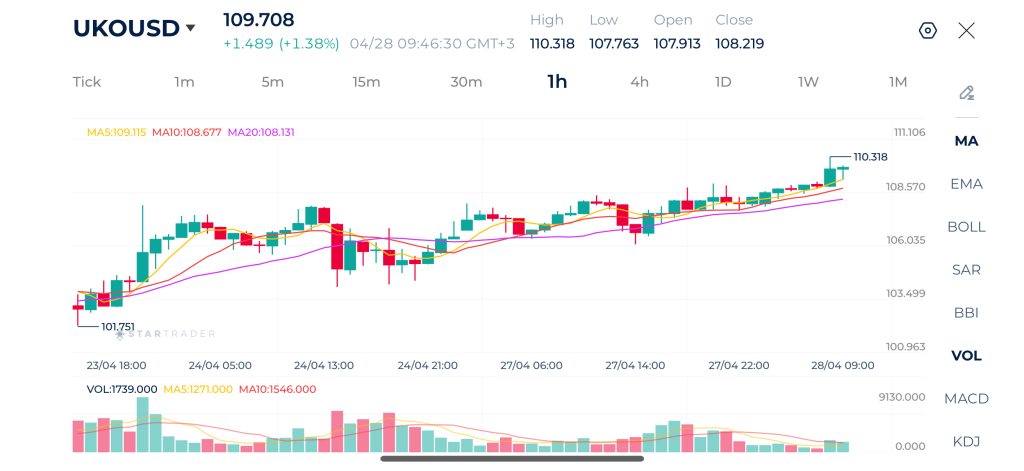
| Resistance | $112.00 | $113.50 | $115.76 |
| Support | $108.13 | $106.75 | $104.26 |
S&P 500 Technical Analysis
The S&P 500 is trading near 7,173 fter rejecting from a recent high at the psychological level 7,200. Despite the minor pullback, the broader structure remains bullish, as price is still holding close to all major moving averages: MA5, MA10, and MA20. The current move appears more like profit-taking or consolidation after a strong rally.
A recovery above 7,186 would restore bullish momentum quickly, while a break below 7,150 may trigger a deeper retracement. Volume is relatively light during the pullback, indicating sellers are not aggressive. This favors consolidation rather.
Bias is generally bullish with the trend intact above 7,150.
S&P 500 1H Chart
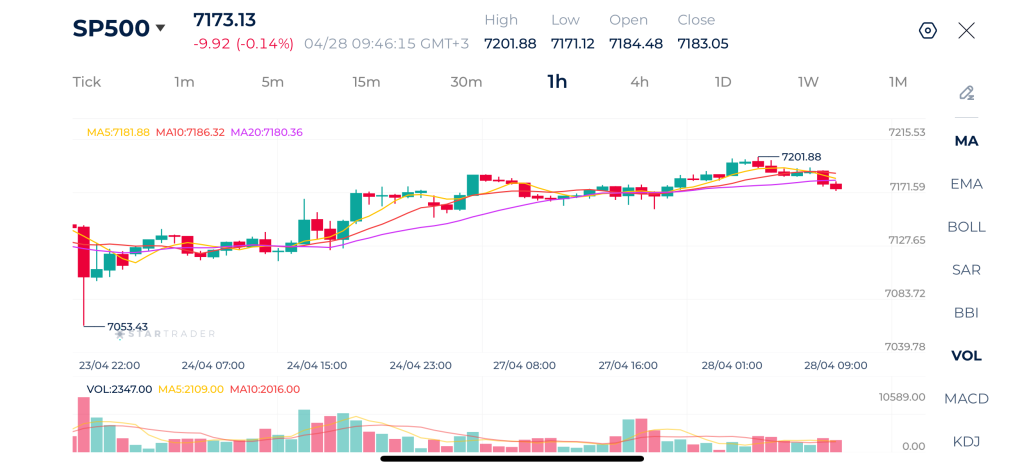
| Resistance | 7,200 | 7,250 | 7,300 |
| Support | 7,132 | 7,095 | 7,053 |
Risk Disclaimer: This material is provided for informational purposes only and does not constitute a recommendation or investment advice. Trading financial instruments on margin involves substantial risk and may not be appropriate for all investors.
Tags
Open Live Account
Please enter a valid country
No results found
No results found
Please enter a valid email
Please enter a valid verification code
1. 8-16 characters + numbers (0-9) 2. blend of letters (A-Z, a-z) 3. special characters (e.g, !a#S%^&)
Please enter the correct format
Please tick the checkbox to proceed
Please tick the checkbox to proceed
Important Notice
STARTRADER does not accept any applications from Australian residents.
To comply with regulatory requirements, clicking the button will redirect you to the STARTRADER website operated by STARTRADER PRIME GLOBAL PTY LTD (ABN 65 156 005 668), an authorized Australian Financial Services Licence holder (AFSL no. 421210) regulated by the Australian Securities and Investments Commission.
CONTINUEImportant Notice for Residents of the United Arab Emirates
In alignment with local regulatory requirements, individuals residing in the United Arab Emirates are requested to proceed via our dedicated regional platform at startrader.ae, which is operated by STARTRADER Global Financial Consultation & Financial Analysis L.L.C.. This entity is licensed by the UAE Capital Market Authority (CMA) under License No. 20200000241, and is authorised to introduce financial services and promote financial products in the UAE.
Please click the "Continue" button below to be redirected.
CONTINUEError! Please try again.

