


Gold Technical Analysis
Gold is showing signs of stabilization after the aggressive selloff that pushed prices from $4,541 down to a low of 4,268. Following the decline, the precious metal has entered a consolidation phase and is gradually building a recovery structure. Price is currently trading above the 5-period, 10-period, and 20-period moving averages, indicating that short-term momentum has shifted in favor of buyers.
A breakout above this region would strengthen the bullish case and potentially trigger a move toward $4,485. On the downside, support is located at $4,320, followed by $4,268. Overall, the short-term outlook has improved from bearish to neutral-bullish, with buyers gradually regaining control.
Gold 1H Chart
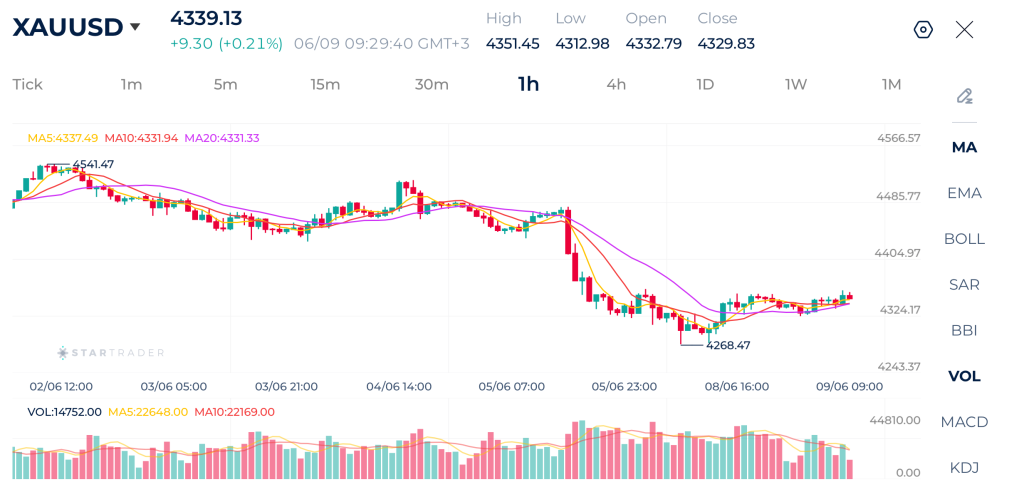
| Resistance | $4,365 | $4,401 | $4,433 |
| Support | $4,312 | $4,288 | $4,268 |
Brent Technical Analysis
Brent crude oil has shifted back into a bearish short-term structure after failing to sustain the previous rally toward $97.60. The market experienced a sharp reversal from that high and has since produced a series of lower highs and lower lows, indicating that sellers have regained control. Price is currently trading below the 5-period, 10-period, and 20-period moving averages, while the moving averages themselves are aligned negatively, confirming the bearish momentum.
Immediate support is located at $92.60, followed by $92.00. Resistance is found at $93.70, then $94.30 and the major resistance zone around $95.80. As long as Brent remains below the 20-period moving average, rallies are likely to encounter selling pressure. The short-term outlook remains bearish.
Brent 1H Chart
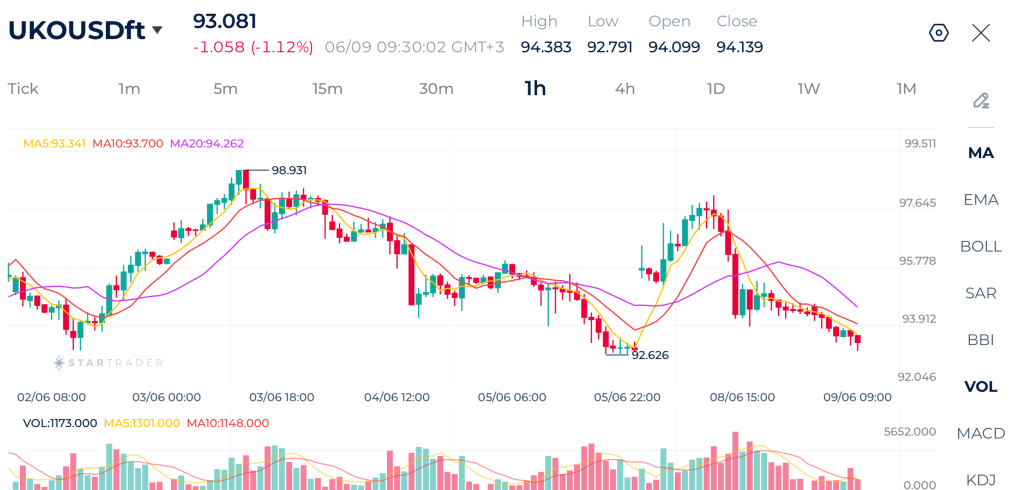
| Resistance | $94.30 | $95.80 | $97.00 |
| Support | $92.60 | $92.00 | $91.74 |
Nasdaq Technical Analysis
The NASDAQ 100 is showing early signs of recovery after the sharp selloff that drove the index from the 30,795 high down to a low of 28,770. The recovery has pushed the index back above the 5-period, 10-period, and 20-period moving averages, which is the first meaningful bullish development since the decline began.
Immediate resistance is located around 29,780, followed by the psychological 30,000 level and then 30,380. On the downside, support is found at 29,500, followed by 29,180 and the major low at 28,770. Overall, the short-term outlook has improved to moderately bullish, although confirmation would require a sustained break above 30,000.
Nasdaq Chart
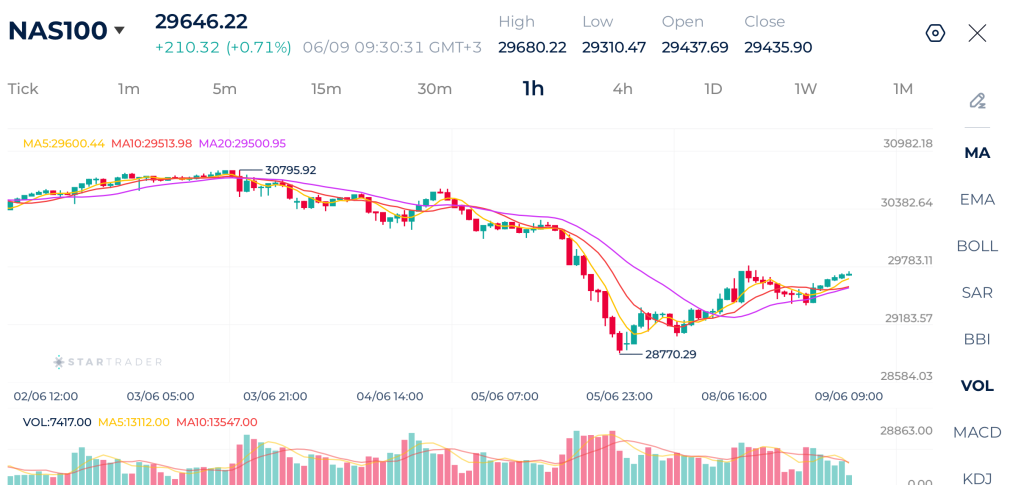
| Resistance | 29,698 | 29,821 | 30,053 |
| Support | 29,266 | 29,182 | 28,928 |
Risk Disclaimer: This material is provided for informational purposes only and does not constitute a recommendation or investment advice. Trading financial instruments on margin involves substantial risk and may not be appropriate for all investors.
Tags
Open Live Account
Please enter a valid country
No results found
No results found
Please enter a valid email
Please enter a valid verification code
1. 8-16 characters + numbers (0-9) 2. blend of letters (A-Z, a-z) 3. special characters (e.g, !a#S%^&)
Please enter the correct format
Please tick the checkbox to proceed
Please tick the checkbox to proceed
Important Notice
STARTRADER does not accept any applications from Australian residents.
To comply with regulatory requirements, clicking the button will redirect you to the STARTRADER website operated by STARTRADER PRIME GLOBAL PTY LTD (ABN 65 156 005 668), an authorized Australian Financial Services Licence holder (AFSL no. 421210) regulated by the Australian Securities and Investments Commission.
CONTINUEImportant Notice for Residents of the United Arab Emirates
In alignment with local regulatory requirements, individuals residing in the United Arab Emirates are requested to proceed via our dedicated regional platform at startrader.ae, which is operated by STARTRADER Global Financial Consultation & Financial Analysis L.L.C.. This entity is licensed by the UAE Capital Market Authority (CMA) under License No. 20200000241, and is authorised to introduce financial services and promote financial products in the UAE.
Please click the "Continue" button below to be redirected.
CONTINUEError! Please try again.

