


Gold Technical Analysis
Gold has regained bullish momentum after rebounding strongly from the $3,942 support area. Price is trading above the 20-period moving average, while the 5 and 10-period moving averages have crossed back above the MA20, confirming a renewed short-term uptrend. The moving averages are now positively aligned, reflecting improving market sentiment.
Following the sharp rally toward $4,116, gold experienced a healthy pullback before finding buyers near the rising moving averages. The latest candles show higher lows and renewed buying interest, indicating that bulls remain in control despite recent consolidation.
The short-term outlook remains bullish while gold trades above $4,055–$4,030. A sustained break above $4,080 would likely lead to another test of $4,116, with potential for further upside toward $4,150. A break below $4,030 would weaken bullish momentum and expose the $3,980 support area.
Gold 1H Chart
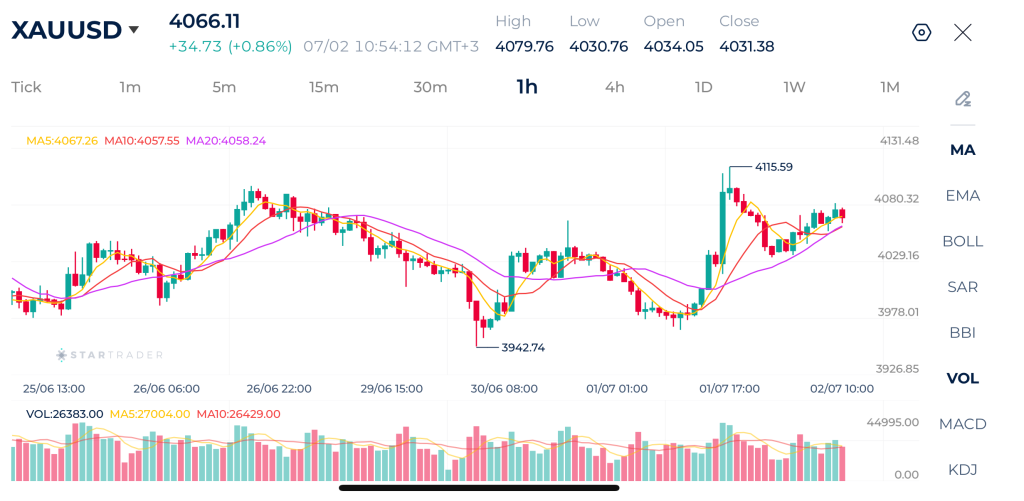
| Resistance | $4,115 | $4,155 | $4,218 |
| Support | $4,029 | $3,987 | $3,942 |
Brent Technical Analysis
Brent crude remains firmly in a bearish trend, with price continuing to trade below the downward-sloping 20-period moving average. Although the market has attempted a modest rebound from $70.15, the recovery has been limited, and the moving averages remain bearishly aligned. The broader technical structure continues to favour sellers.
After breaking below the key $71.30 support zone, Brent accelerated lower and established a fresh swing low at $70.15. The current rebound remains shallow and appears corrective rather than impulsive, with price still unable to reclaim the 20-period moving average.
The latest candles indicate that buyers are attempting to stabilize the market, but momentum remains weak and insufficient to signal a trend reversal.
The short-term bias remains bearish while Brent trades below $71.30. Failure to reclaim this resistance keeps the focus on another test of $70.15, with scope for an extension toward $69.80 if selling pressure resumes. A sustained move above $71.30 would be the first indication that bearish momentum is beginning to fade.
Brent 1H Chart
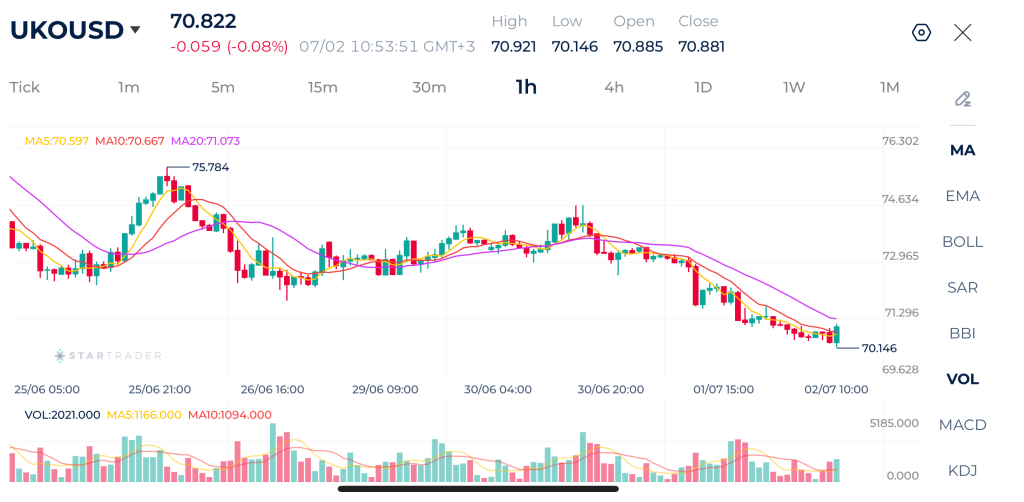
| Resistance | $71.29 | $72.00 | $73.00 |
| Support | $70.00 | $69.12 | $68.20 |
Nasdaq Technical Analysis
Nasdaq 100 has shifted into a short-term bearish correction after failing to sustain gains above the 30,300 area. Price is now trading below all three moving averages (MA5, MA10, and MA20), with the moving averages aligned bearishly, confirming that downside momentum has strengthened.
The break below the 20-period moving average suggests the recent bullish trend has lost momentum, and sellers currently have control.
Volume has remained relatively steady during the decline, indicating that selling pressure is supported by active participation rather than merely a lack of buyers.
The short-term outlook has turned bearish. As long as price remains below 30,000, sellers are likely to retain control, with the next downside target around 29,450 followed by 29,230. A recovery above 30,000 would ease immediate selling pressure and shift focus back toward 30,300.
Nasdaq 1H Chart
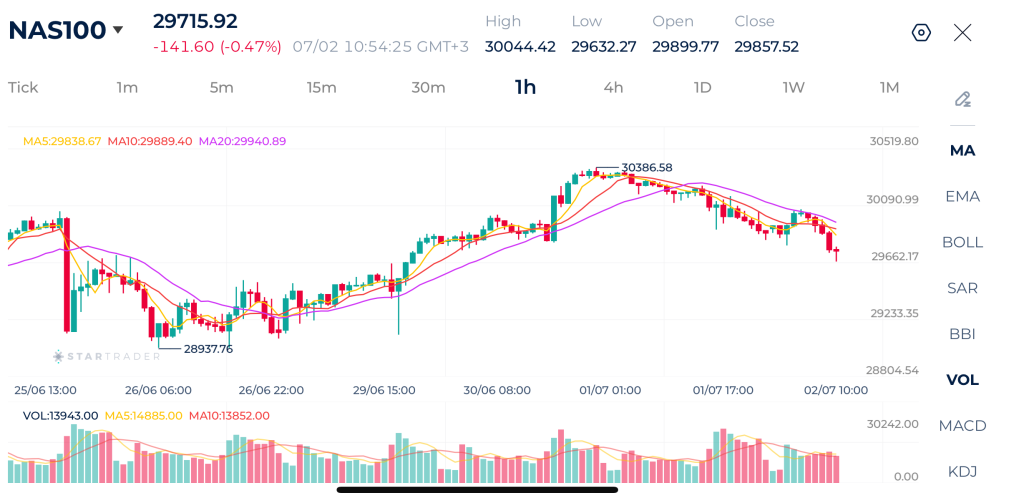
| Resistance | 29,975 | 30,086 | 30,200 |
| Support | 29,415 | 29,233 | 28,964 |
Risk Disclaimer: This material is provided for informational purposes only and does not constitute a recommendation or investment advice. Trading financial instruments on margin involves substantial risk and may not be appropriate for all investors.
Tags
Open Live Account
Please enter a valid country
No results found
No results found
Please enter a valid email
Please enter a valid verification code
1. 8-16 characters + numbers (0-9) 2. blend of letters (A-Z, a-z) 3. special characters (e.g, !a#S%^&)
Please enter the correct format
Please tick the checkbox to proceed
Please tick the checkbox to proceed
Important Notice
STARTRADER does not accept any applications from Australian residents.
To comply with regulatory requirements, clicking the button will redirect you to the STARTRADER website operated by STARTRADER PRIME GLOBAL PTY LTD (ABN 65 156 005 668), an authorized Australian Financial Services Licence holder (AFSL no. 421210) regulated by the Australian Securities and Investments Commission.
CONTINUEImportant Notice for Residents of the United Arab Emirates
In alignment with local regulatory requirements, individuals residing in the United Arab Emirates are requested to proceed via our dedicated regional platform at startrader.ae, which is operated by STARTRADER Global Financial Consultation & Financial Analysis L.L.C.. This entity is licensed by the UAE Capital Market Authority (CMA) under License No. 20200000241, and is authorised to introduce financial services and promote financial products in the UAE.
Please click the "Continue" button below to be redirected.
CONTINUEError! Please try again.

