


Gold Technical Analysis
Gold remains bullish from a structural perspective, even though price is currently consolidating just below the recent high around $4,888. The broader trend remains intact, characterized by a consistent sequence of higher highs and higher lows.
The moving averages strongly support this bullish bias. Price is comfortably trading above MA(5), MA(10), and MA(30), all of which are sloping upward.
Momentum remains positive, with the MACD holding above the zero line. Technically, the $4,800–$4,780 zone is the most important support area to monitor, while a sustained break above $4,890 would likely open the door for another bullish extension. Overall, gold remains in a strong bullish continuation phase despite short-term consolidation.
Gold 4H Chart
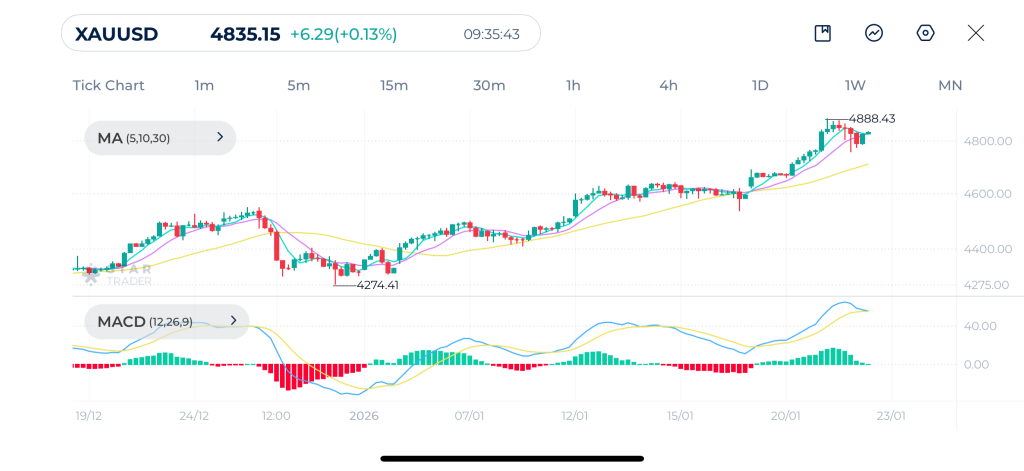
| Resistance | $4,861 | $4,890 | $4,900 |
| Support | $4,756 | $4,715 | $4,690 |
Dow Jones Technical Analysis
On the 4-hour timeframe, Dow Jones is attempting to recover after a corrective decline from the 49,700 highs. The recent price action shows a sharp bounce from the 48,600–48,700 area, which acted as a strong demand zone and previously served as a higher low within the broader uptrend.
Price has reclaimed the short term moving averages MA(5) and MA(10) and is now approaching the 30-period moving average. This area is critical, as the 30-period moving average has acted as both support and resistance during previous swings. A sustained break and hold above this average would signal that the corrective phase is likely complete and that the broader bullish trend may resume.
Momentum has started to improve, as reflected by the MACD. The indicator has crossed back above the signal line. This shift suggests that bearish momentum is fading and that bullish momentum is gradually rebuilding. Resistance remains near the 49,700 high, while support is established around 48,600.
Dow Jones 4H Chart
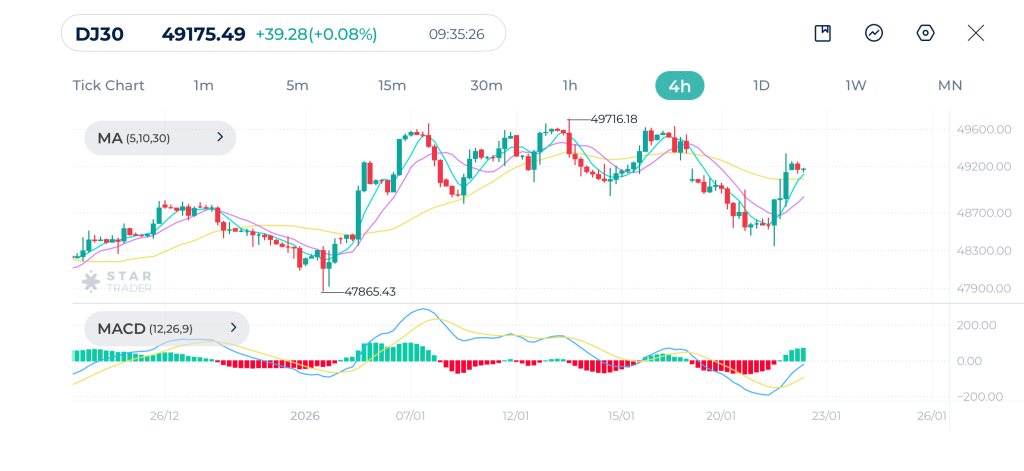
| Resistance | 49,358 | 49,605 | 49,770 |
| Support | 48,908 | 48,691 | 48,436 |
EURUSD Technical Analysis
EURUSD is currently trading near the 1.1690 area after a strong bullish impulse. This rally marked a clear shift in short-term structure.
Price remains above the 30-period moving average, which continues to slope upward and act as dynamic support. The shorter moving averages MA(5) and MA(10) have started to flatten and slightly roll over, reflecting short-term indecision. As long as price holds above the 30-period average, the broader intraday bullish structure remains valid, but failure to regain strength above the short-term averages would increase the risk of a deeper pullback.
MACD has started to contract after a strong positive expansion, and the MACD line has crossed slightly below the signal line. Technically, the 1.1650–1.1660 zone now represents key support, while the 1.1750 area remains the main resistance.
EURUSD 4H Chart
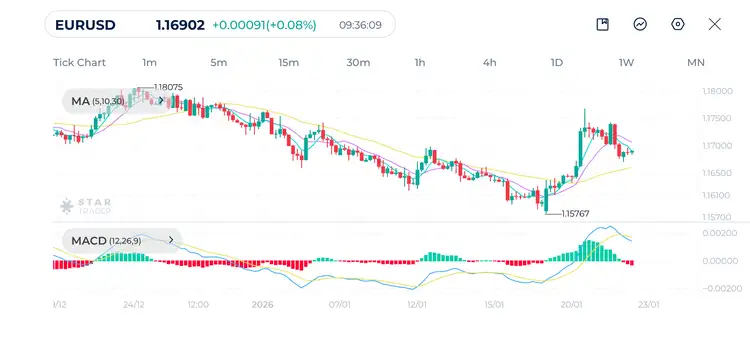
| Resistance | 1.1742 | 1.1768 | 1.1795 |
| Support | 1.1699 | 1.1641 | 1.1611 |
Tags
Open Live Account
Please enter a valid country
No results found
No results found
Please enter a valid email
Please enter a valid verification code
1. 8-16 characters + numbers (0-9) 2. blend of letters (A-Z, a-z) 3. special characters (e.g, !a#S%^&)
Please enter the correct format
Please tick the checkbox to proceed
Please tick the checkbox to proceed
Important Notice
STARTRADER does not accept any applications from Australian residents.
To comply with regulatory requirements, clicking the button will redirect you to the STARTRADER website operated by STARTRADER PRIME GLOBAL PTY LTD (ABN 65 156 005 668), an authorized Australian Financial Services Licence holder (AFSL no. 421210) regulated by the Australian Securities and Investments Commission.
CONTINUEImportant Notice for Residents of the United Arab Emirates
In alignment with local regulatory requirements, individuals residing in the United Arab Emirates are requested to proceed via our dedicated regional platform at startrader.ae, which is operated by STARTRADER Global Financial Consultation & Financial Analysis L.L.C.. This entity is licensed by the UAE Capital Market Authority (CMA) under License No. 20200000241, and is authorised to introduce financial services and promote financial products in the UAE.
Please click the "Continue" button below to be redirected.
CONTINUEError! Please try again.

