


market news summary
USDX holds above 103;
Gold targets $1,785;
Crude is under pressure.
U.S. Dollar Index (USDX)
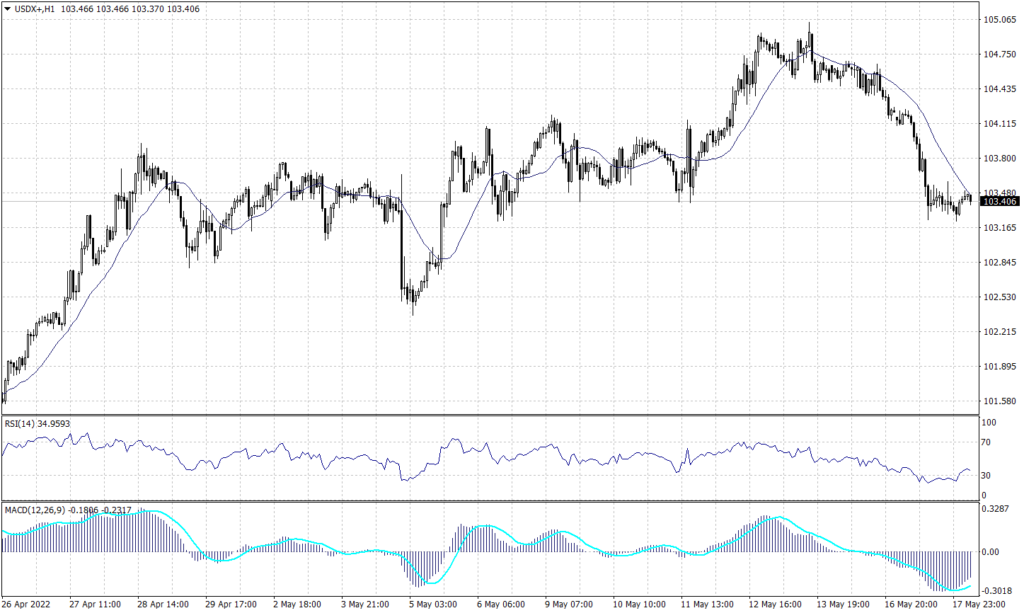
The U.S. Dollar Index started the fourth declining day in what is seen as a corrective movement trading slightly below the support of 103.60. On the daily chart, the long term remains positive above the 20-day moving average.
On the daily chart, the index shows a slight possibility for a continuation of the uptrend. However, the hourly chart shows support around the current levels between 103.40 and 103.60.
PIVOT POINT: 103.60
| SUPPORT | RESISTANCE |
| 103.20 | 104.10 |
| 102.85 | 104.80 |
| 102.50 | 105.00 |
Euro (EURUSD)
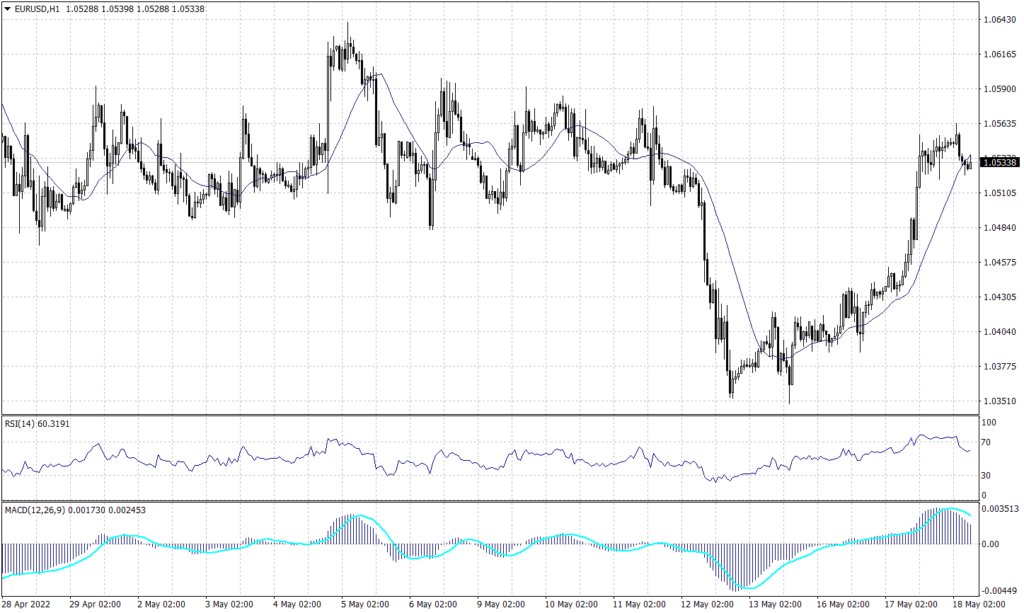
The common currency remains in a downwards trend over the daily time frame, even with the gains recorded over the last several days. The EURUSD touched resistance at 1.0540 before showing a tendency to trade lower.
Technical indicators show a higher possibility to fall than continuing the uptrend, however, the moving average on the daily chart remains above the current price levels.
PIVOT POINT: 1.0540
| SUPPORT | RESISTANCE |
| 1.0490 | 1.0590 |
| 1.0350 | 1.0650 |
| 1.0200 | 1.0675 |
Sterling Pounds (GBPUSD)
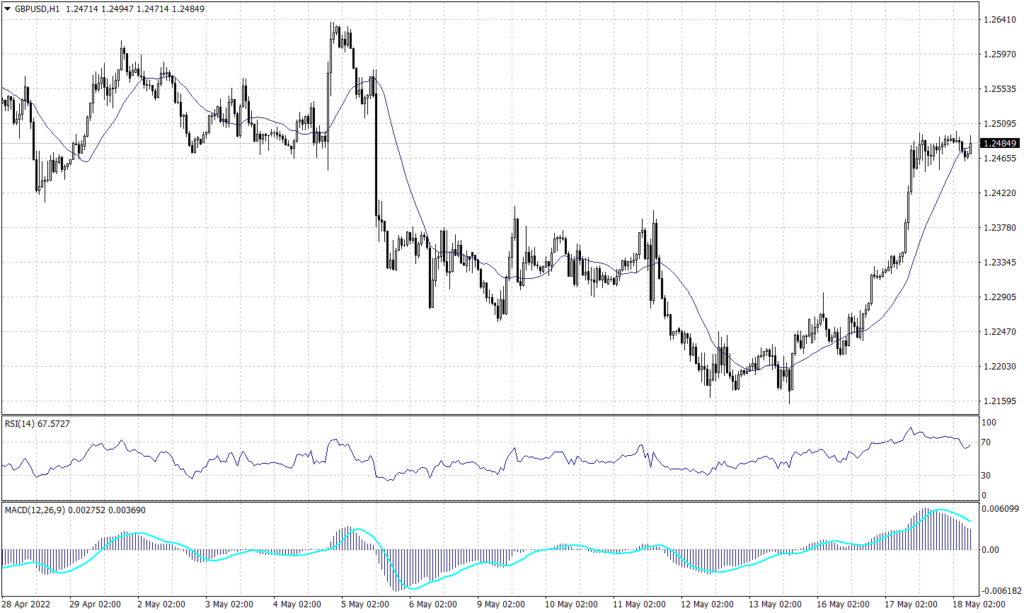
The Sterling pound traded horizontally this morning and built a neutral level. However, the chart shows a reversal pattern on the hourly chart while it signals a continuation of the long-term negative trend on the daily chart.
The RSI and MACD are showing signals for a further decline, while price action retains the reading of 1.2100 during the day.
PIVOT POINT: 1.2400
| SUPPORT | RESISTANCE |
| 1.2100 | 1.2500 |
| 1.1980 | 1.2565 |
| 1.1900 | 1.2690 |
Japanese Yen (USDJPY)
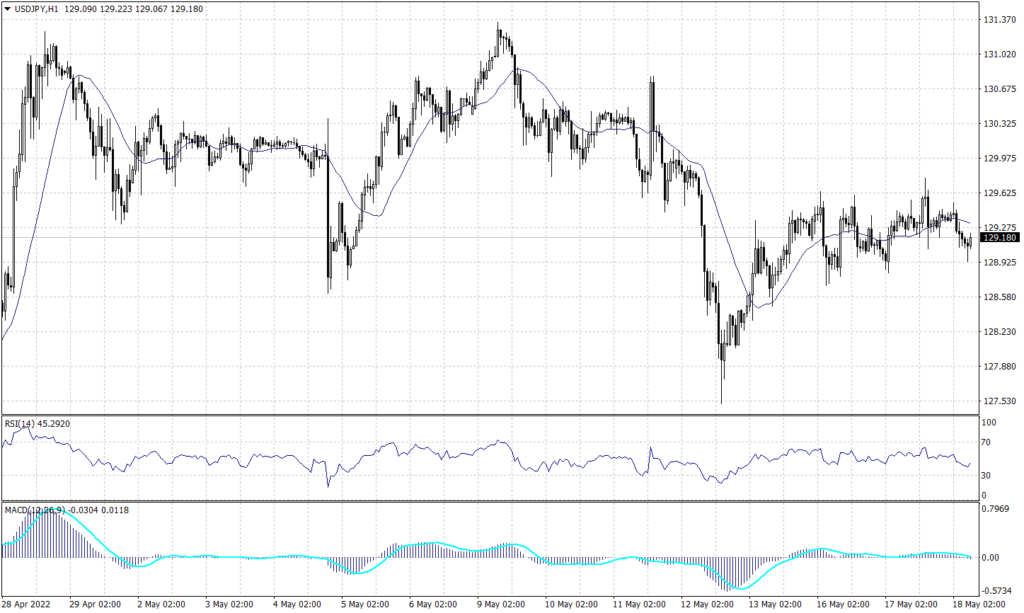
The USDJPY pair traded below the support of 130.30 for the fourth consecutive day and formed a declining pattern on the hourly chart. Meanwhile, on the daily chart, the pair remains in the uptrend unless it broke below the support of 128.70. While the moving average reading indicates that the current level is critical resistance, MACD and RSI readings are neutral.
PIVOT POINT: 129.30
| SUPPORT | RESISTANCE |
| 128.35 | 130.60 |
| 128.00 | 131.30 |
| 127.80 | 132.00 |
Spot Gold (XAUUSD)
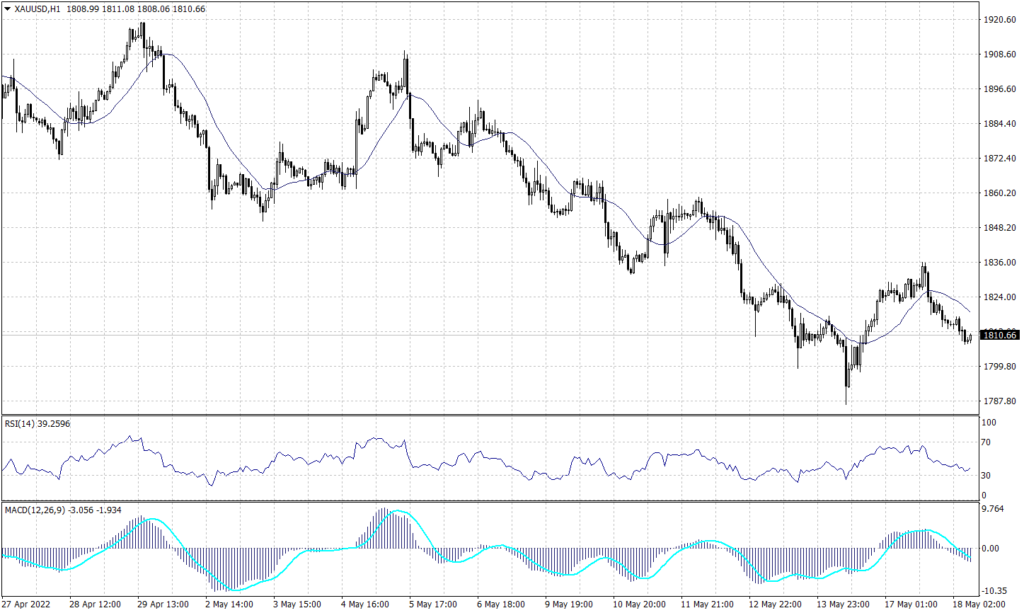
Spot Gold sharply declined to its lowest since late January at $1,786 per ounce early this week before bouncing back to 1,825. The precious metal traded lower today at 1,810 signalling further decline targeting 1,785 on the short run and 1,750 over the long run.
Meanwhile, the hourly chart shows support at the current levels that might slow down the decline. Furthermore, both the RSI and the MACD imply that the bearish trend will continue.
PIVOT POINT: 1,810
| SUPPORT | RESISTANCE |
| 1,800 | 1,875 |
| 1,792 | 1,895 |
| 1,785 | 1,905 |
West Texas Crude (USOUSD)
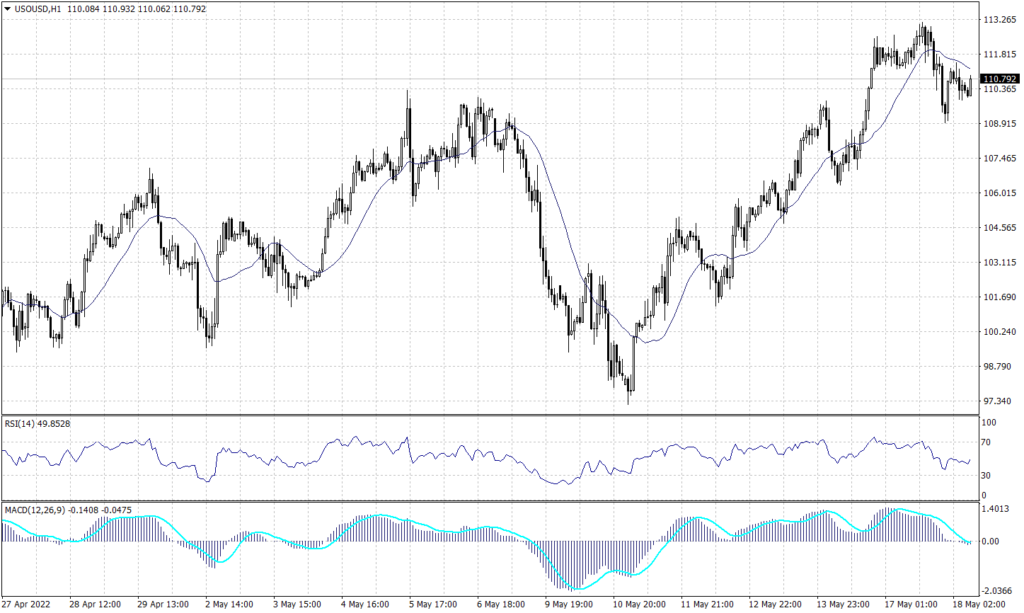
Crude oil is trading on an uptrend hovering above 110 for the third day amid supply worries. Meanwhile, on the hourly chart, the crude shows support at $107.10 and resistance below $111.30.
Due to the heavy buying pressure, technical indicators show a possibility to see crude oil lower at $107. However, price action and moving average are showing a higher probability to continue climbing.
PIVOT POINT: 110.00
| SUPPORT | RESISTANCE |
| 107.10 | 111.30 |
| 105.75 | 112.75 |
| 104.30 | 115.00 |
Tags
Open Live Account
Please enter a valid country
No results found
No results found
Please enter a valid email
Please enter a valid verification code
1. 8-16 characters + numbers (0-9) 2. blend of letters (A-Z, a-z) 3. special characters (e.g, !a#S%^&)
Please enter the correct format
Please tick the checkbox to proceed
Please tick the checkbox to proceed
Important Notice
STARTRADER does not accept any applications from Australian residents.
To comply with regulatory requirements, clicking the button will redirect you to the STARTRADER website operated by STARTRADER PRIME GLOBAL PTY LTD (ABN 65 156 005 668), an authorized Australian Financial Services Licence holder (AFSL no. 421210) regulated by the Australian Securities and Investments Commission.
CONTINUEImportant Notice for Residents of the United Arab Emirates
In alignment with local regulatory requirements, individuals residing in the United Arab Emirates are requested to proceed via our dedicated regional platform at startrader.ae, which is operated by STARTRADER Global Financial Consultation & Financial Analysis L.L.C.. This entity is licensed by the UAE Capital Market Authority (CMA) under License No. 20200000241, and is authorised to introduce financial services and promote financial products in the UAE.
Please click the "Continue" button below to be redirected.
CONTINUEError! Please try again.

