








 Web Trader MT5









Gold Technical Analysis
Gold has shifted into a bearish correction phase after topping at $4,381. Price is now consistently closing below the moving averages MA(5) and MA(10), and short-term averages have crossed beneath the 30-period MA, confirming trend reversal signals. The precious metal currently trades around $3,940, losing momentum after the parabolic rally earlier this month.
The MACD remains bearish, showing downside pressure still firm.
The short-term trend is leaning bearish, but within a longer term upward trend. It’s important to monitor price reaction around the psychological support level $4,000. Watch for bullish reversal candles around $3,800.
Gold 1H Chart
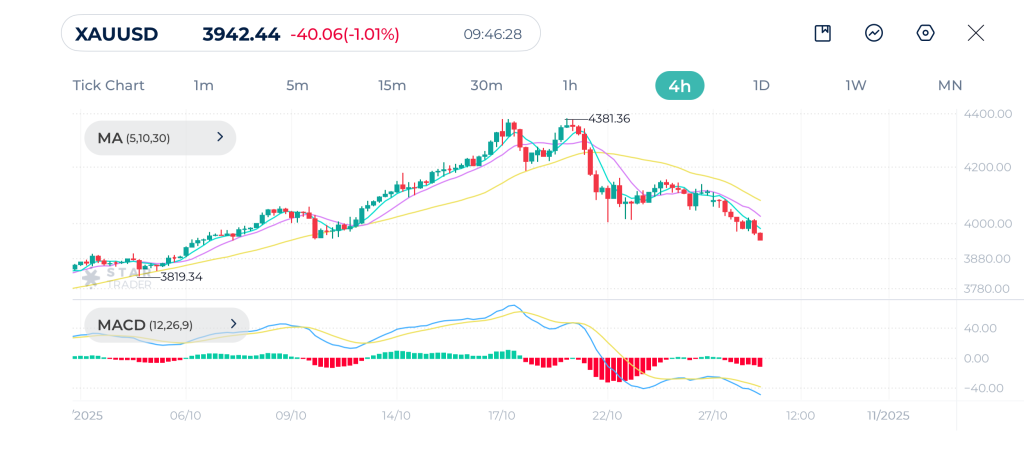
| Resistance | $3,959 | $3,982 | $4,020 |
| Support | $3,926 | $3,885 | $3,866 |
Nasdaq Technical Analysis
Nasdaq 100 shows a strong bullish trend continuation as price continues to form higher highs and higher lows, with candles aligned above the three moving averages MA(5), MA(10) and MA(30), showing upward momentum intact.
The MACD remains positive above the signal line, though the slope is flattening, suggesting bullish momentum slowing but still present. A correction may happen before the next rally leg.
Overall trend on Nasdaq remains bullish with momentum still strong. It’s important to monitor price reaction if it corrects to the dynamic support levels of MA(10) and MA(30).
Nasdaq 1H Chart
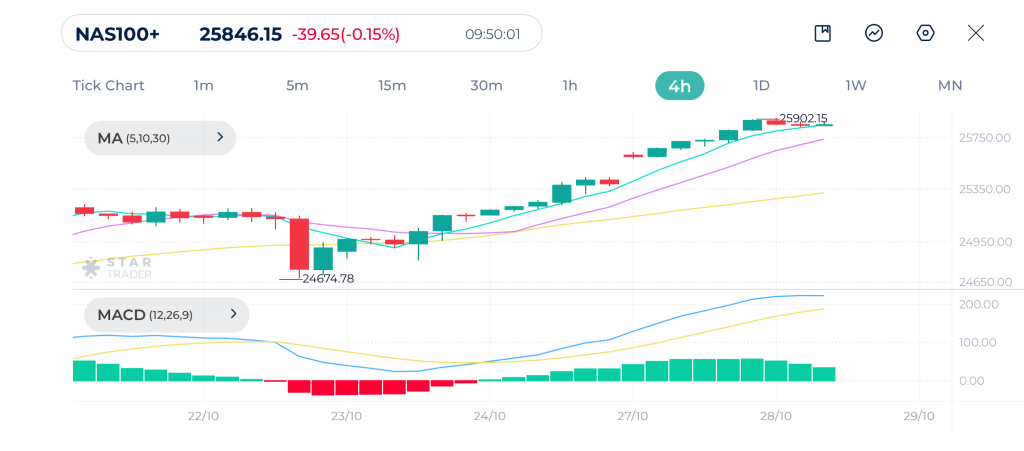
| Resistance | 25,845 | 25,872 | 25,900 |
| Support | 25,800 | 25,774 | 25,700 |
Bitcoin Technical Analysis
Bitcoin broke the psychological $115,000 level and reached $116,390 yesterday, but has since rolled into a corrective pullback. Price is currently trading under the short-term moving averages MA(5) and MA(10) and it’s currently very close to the 30-period moving average on the 1H chart.
MACD line has crossed toward the signal line, showing momentum is shifting from positive to neutral or bearish.
If price reclaims the $115–$116 zone with force, we may see another strong movement up, fueled by short liquidations. However, if price breaks and holds under $111k, we can expecte another drop toward the $109k area and lower support thereafter.
Bitcoin 1H Chart
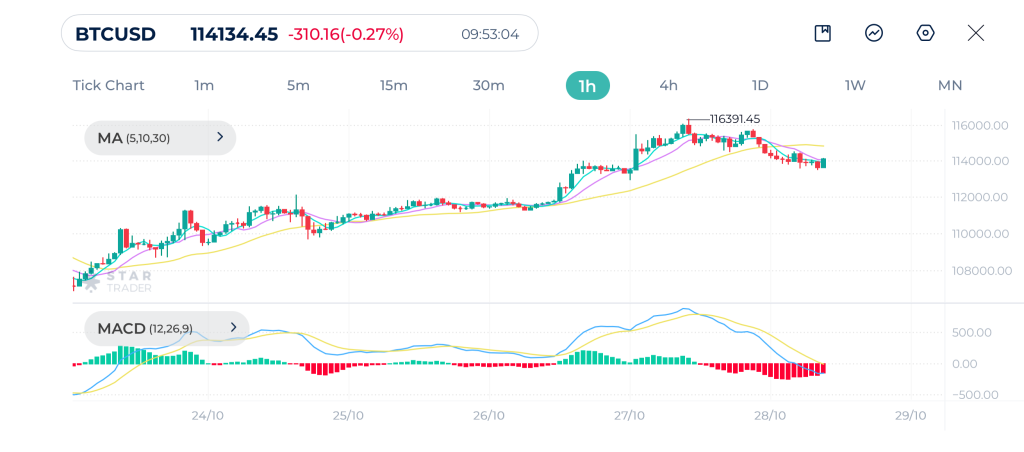
| Resistance | $114,550 | $114,838 | $115,260 |
| Support | $113,542 | $112,975 | $112,800 |
Tags


Open Live Account
 Email Address
 Phone Number
Important Notice
STARTRADER does not accept any applications from Australian residents.
To comply with regulatory requirements, clicking the button will redirect you to the STARTRADER website operated by STARTRADER PRIME GLOBAL PTY LTD (ABN 65 156 005 668), an authorized Australian Financial Services Licence holder (AFSL no. 421210) regulated by the Australian Securities and Investments Commission.
Important Notice for Residents of the United Arab Emirates
In alignment with local regulatory requirements, individuals residing in the United Arab Emirates are requested to proceed via our dedicated regional platform at startrader.ae, which is operated by STARTRADER Global Financial Consultation & Financial Analysis L.L.C.. This entity is licensed by the UAE Capital Market Authority (CMA) under License No. 20200000241, and is authorised to introduce financial services and promote financial products in the UAE.
Please click the "Continue" button below to be redirected.


