


Gold Technical Analysis
Gold remains strongly bullish on the 1-hour chart, trading above $5,250. Price action shows successive higher highs and higher lows, and the latest push to new highs confirms continued buyer dominance.
Price is still well above the three moving averages, MA(5), MA(10), and MA(30), all of which are sharply sloping upward, and acting as dynamic support. This alignment reflects strong trend strength.
MACD is well above the zero line, indicating accelerating bullish momentum. There is no visible bearish divergence, suggesting that the trend has not yet reached exhaustion. As long as gold holds above the $5,180–$5,200 support zone, the bullish bias remains dominant, and further upside extensions remain favored over any meaningful correction.
Gold 1H Chart
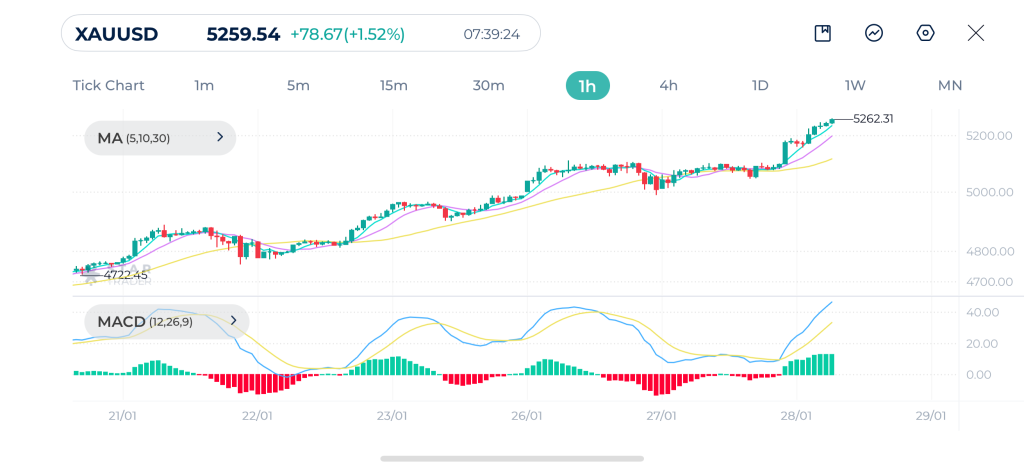
| Resistance | $5,266 | $5,275 | $5,300 |
| Support | $5,224 | $5,189 | $5,157 |
EURUSD Technical Analysis
EURUSD is trading around the 1.1985 area this morning after reaching 1.2080, the highest level since June 2021. The broader short-term structure remains bullish. Price is currently showing a minor correction.
Price is currently still holding above the 30-period moving average, which continues to slope upward and acts as dynamic support. As long as price remains above the rising 30-period average and holds above the 1.1950–1.1930 zone, the broader intraday bullish structure remains intact. A break below this area would increase the risk of a deeper corrective move.
MACD has turned negative after a strong bullish expansion, and the MACD line has crossed below the signal line. This indicates fading bullish momentum. Overall, EURUSD is in a healthy pullback within a bullish trend.
EURUSD 1H Chart
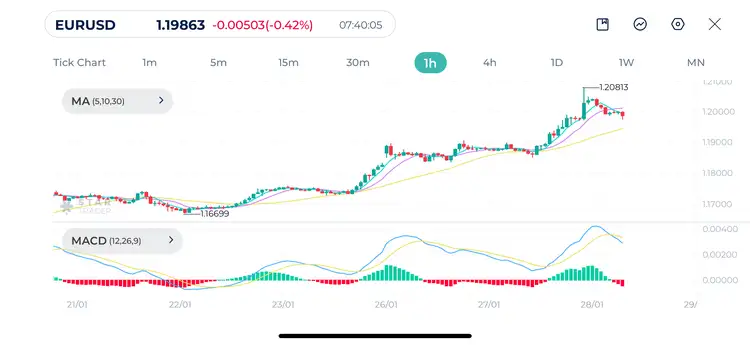
| Resistance | 1.2049 | 1.2080 | 1.2110 |
| Support | 1.1971 | 1.1938 | 1.1905 |
S&P 500 Technical Analysis
S&P 500 continues to trade in a strong bullish structure on the 1-hour timeframe, holding above the 7,000 psychological level. Price action shows higher highs and higher lows, with shallow pullbacks, confirming strong demand and trend stability.
The moving averages reinforce this bullish outlook. Price is trading above all three moving averages, MA(5), MA(10), and MA(30), all of which are positively aligned and sloping upward. The 30-period moving average continues to support the price. This suggests that the trend remains healthy and intact.
MACD remains above the zero line. And there is no sign of bearish divergence. This indicates consolidation within strength. As long as SP500 holds above the 6,950–6,980 area, the overall trend remains bullish.
S&P 500 1H Chart
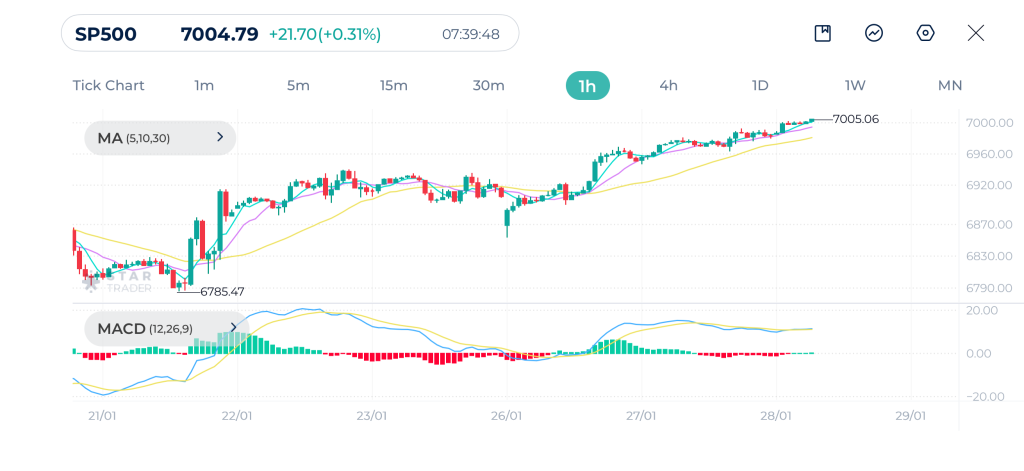
| Resistance | 7,015 | 7,034 | 7,058 |
| Support | 6,994 | 6,983 | 6,972 |
Tags
Open Live Account
Please enter a valid country
No results found
No results found
Please enter a valid email
Please enter a valid verification code
1. 8-16 characters + numbers (0-9) 2. blend of letters (A-Z, a-z) 3. special characters (e.g, !a#S%^&)
Please enter the correct format
Please tick the checkbox to proceed
Please tick the checkbox to proceed
Important Notice
STARTRADER does not accept any applications from Australian residents.
To comply with regulatory requirements, clicking the button will redirect you to the STARTRADER website operated by STARTRADER PRIME GLOBAL PTY LTD (ABN 65 156 005 668), an authorized Australian Financial Services Licence holder (AFSL no. 421210) regulated by the Australian Securities and Investments Commission.
CONTINUEImportant Notice for Residents of the United Arab Emirates
In alignment with local regulatory requirements, individuals residing in the United Arab Emirates are requested to proceed via our dedicated regional platform at startrader.ae, which is operated by STARTRADER Global Financial Consultation & Financial Analysis L.L.C.. This entity is licensed by the UAE Capital Market Authority (CMA) under License No. 20200000241, and is authorised to introduce financial services and promote financial products in the UAE.
Please click the "Continue" button below to be redirected.
CONTINUEError! Please try again.

