


Crude oil is on a downward trend with expectations of lower demand rates as a result of new closures in China that slowed the Chinese economy, the second largest consumer of crude oil in the world. Gold prices also declined, targeting levels below $1,700 an ounce.
U.S. Dollar Index (USDX)
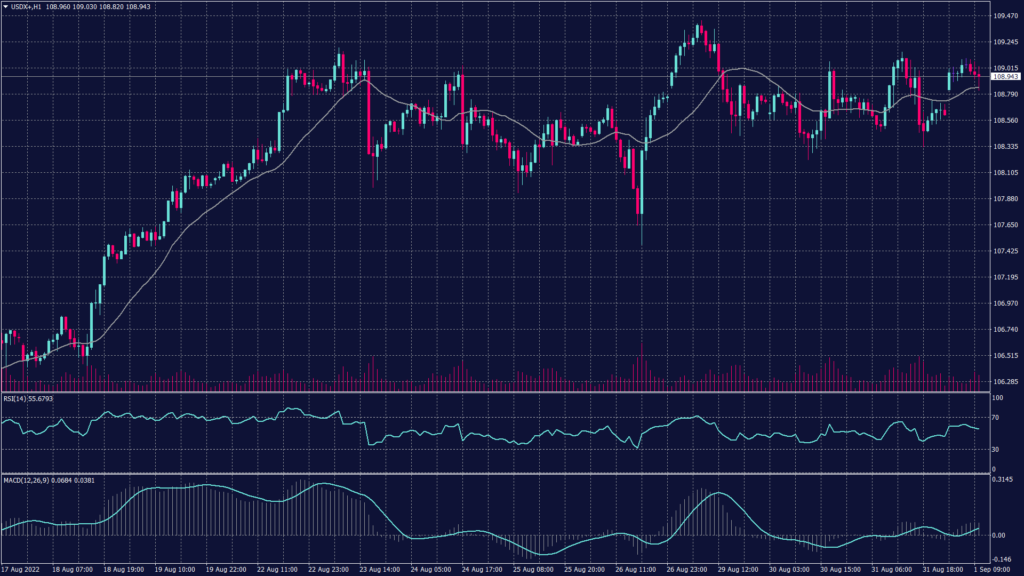
The U.S. dollar index slid lower during the early trades moving just below its two decades high recorded earlier this week. The index was traded at 108.66 this morning, 0.1% below the high at 109.48.
However, the latest JOLTS report on job openings pointed to continued strength in the labor market despite the string of large rate hikes by the Federal Reserve. Additionally, Fed’s members’ hawkish tone pointed to a possible 0.75% interest rate hike in September.
The overall trend remains positive despite the slowdown in the uptrend momentum. The index has built support above 108.40 on the daily chart. However, the momentum is slowing but it remains strong enough to target new high levels. The hourly chart is moving horizontally around the level of 108.80. Technical indicators show support between 108.40 and 108.80 but also indicate lower buying bullish pressure.
Pivot Point: 108.80
| SUPPORT | RESISTANCE |
| 108.40 | 109.10 |
| 108.20 | 109.40 |
| 108.00 | 109.60 |
Euro (EURUSD)
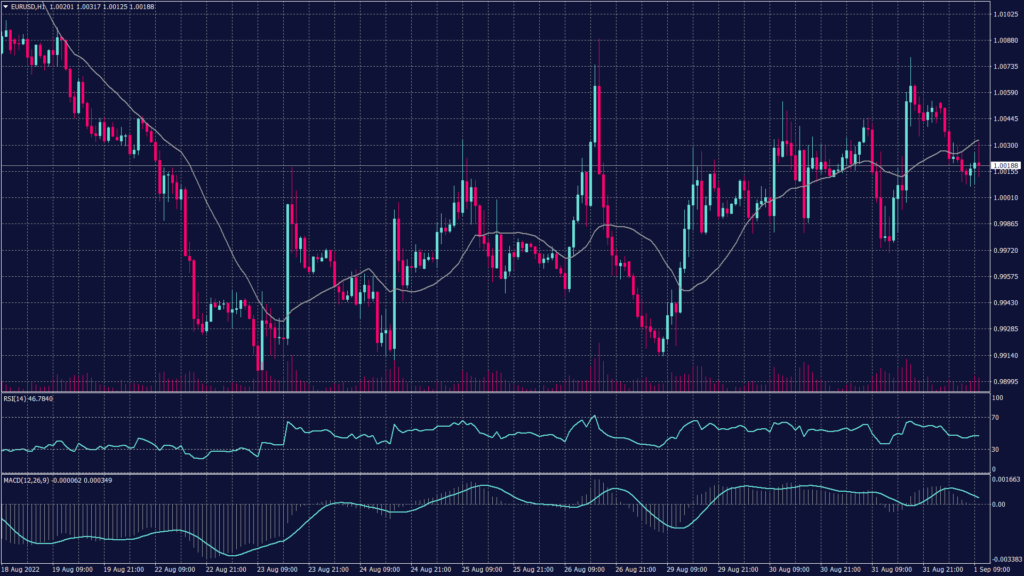
The German retail sales rose 1.9% during July, as consumers showed a capacity of resilience with discretionary spending to face the soaring inflation. Furthermore, data showed Eurozone inflation hitting a new record high at 9.1% on an annual basis in August.
Technically, the EURUSD pair remained positive on the hourly chart supported by bullish pressure between 1.0020 and 1.0040. the pair will be targeting the resistance at 1.0055 on the hourly chart before showing serious impulses in either direction.
Pivot Point: 1.0030
| SUPPORT | RESISTANCE |
| 1.0005 | 1.0055 |
| 0.9990 | 1.0085 |
| 0.9970 | 1.0120 |
Spot Gold (XAUUSD)
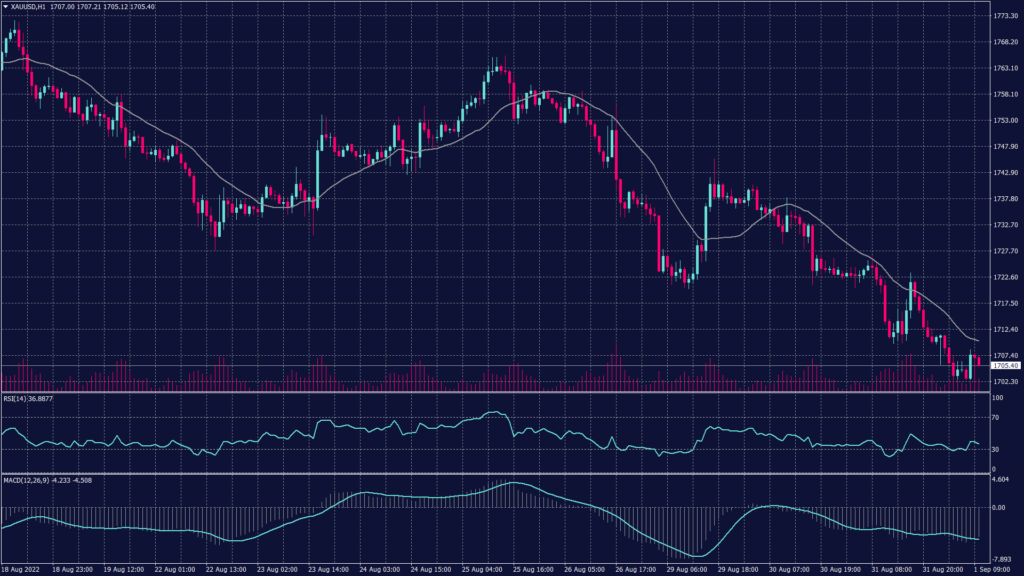
The precious metal continued the decline during the early sessions as the greenback strengthened before the payrolls report on Friday. Spot gold fell 0.3% to $1,706.26 an ounce, touching its weakest level since late July. Meanwhile, Gold futures sank 0.5% to $1,716.75 an ounce.
The yellow metal trend remains negative after finding the resistance between 1,705 and 1,710 on the hourly chart. Technical indicators show a possibility of a horizontal movement between 1,700 and 1,705 before breaking into new short-term lows.
Pivot Point: 1,705
| SUPPORT | RESISTANCE |
| 1,700 | 1,710 |
| 1,685 | 1,715 |
| 1,680 | 1,720 |
West Texas Crude (USOUSD)
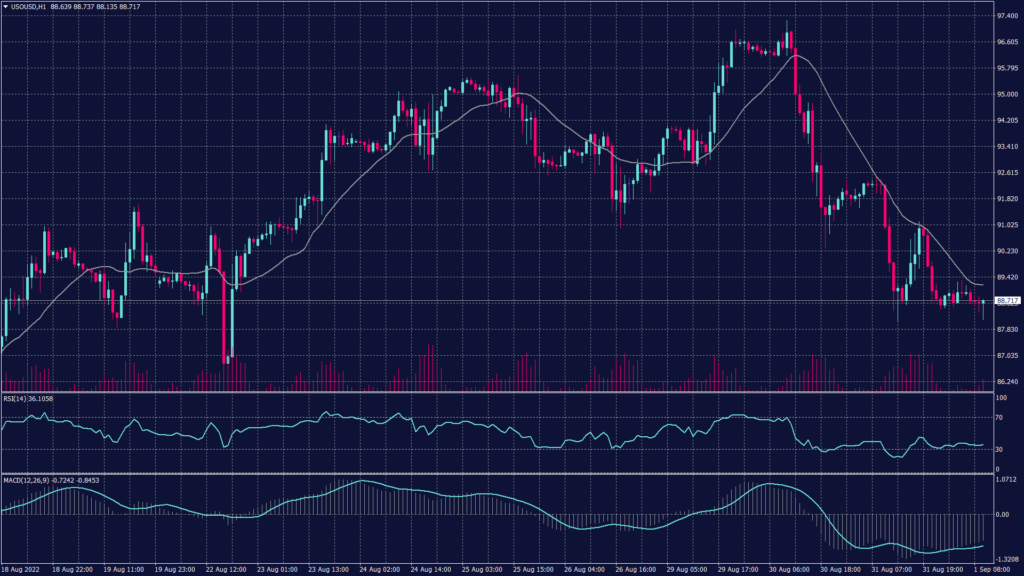
Crude oil prices lost nearly a buck as investors were worried that aggressive interest rate hikes from global policymakers would slow economies and dent fuel demand, while renewed restrictions to curb COVID-19 in China also added pressure.
Brent crude futures fell 0.8% to $94.84 a barrel while WTI crude futures slid 1% to $88.70 a barrel. However, production in both OPEC and the United States has risen to its highest level since the early days of the coronavirus pandemic.
Technically, WTI prices continue to decline to $86 per barrel after breaking the support at $88.25. technical indicators show the downtrend slowing down without any signs of a rebound.
Pivot Point: 88.10
| SUPPORT | RESISTANCE |
| 86.90 | 89.30 |
| 86.15 | 90.10 |
| 85.00 | 90.90 |
Tags
Open Live Account
Please enter a valid country
No results found
No results found
Please enter a valid email
Please enter a valid verification code
1. 8-16 characters + numbers (0-9) 2. blend of letters (A-Z, a-z) 3. special characters (e.g, !a#S%^&)
Please enter the correct format
Please tick the checkbox to proceed
Please tick the checkbox to proceed
Important Notice
STARTRADER does not accept any applications from Australian residents.
To comply with regulatory requirements, clicking the button will redirect you to the STARTRADER website operated by STARTRADER PRIME GLOBAL PTY LTD (ABN 65 156 005 668), an authorized Australian Financial Services Licence holder (AFSL no. 421210) regulated by the Australian Securities and Investments Commission.
CONTINUEImportant Notice for Residents of the United Arab Emirates
In alignment with local regulatory requirements, individuals residing in the United Arab Emirates are requested to proceed via our dedicated regional platform at startrader.ae, which is operated by STARTRADER Global Financial Consultation & Financial Analysis L.L.C.. This entity is licensed by the UAE Capital Market Authority (CMA) under License No. 20200000241, and is authorised to introduce financial services and promote financial products in the UAE.
Please click the "Continue" button below to be redirected.
CONTINUEError! Please try again.

