


The Greenback slows a bit as expectations of lower hikes are increasing while U.S. Treasury yields remained pinned near their highest levels since the 2008 financial crisis. While hopes of a potential dovish tilt by the Federal Reserve somewhat benefited gold prices last week, markets are still pricing in a nearly 100% chance of a 75-basis point rate hike by the Fed in November.
On the other hand, the Sterling pound puts further challenges to the new PM Sunak who leans fiscally conservative, is expected to tighten fiscal policy further by hiking taxes or cutting government spending.
U.S. Dollar Index (USDX)
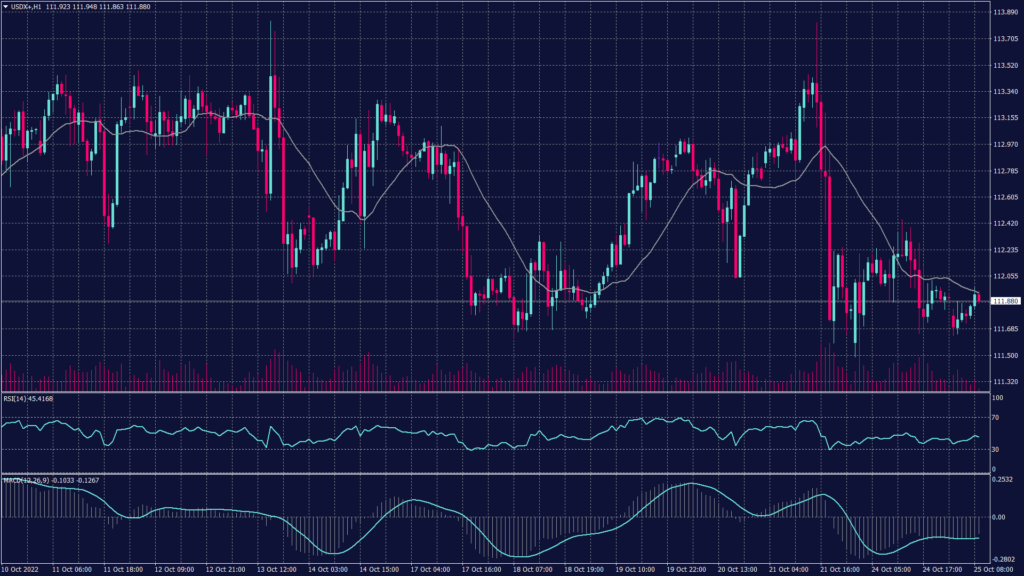
The Greenback eased against peers on Tuesday amid signs Federal Reserve rate hikes might hit the brakes, while risk sentiment improved with Rishi Sunak about to become Britain’s prime minister.
The dollar index eased to 111.78 near Friday’s low of 111.68, the weakest level in three weeks. The greenback softened after S&P flash PMI data overnight showed U.S. business activity contracting for a fourth straight month in October, the latest evidence of an economy slowing in the face of high inflation and rising interest rates.
On the hourly chart, the Index remains solid above 112 and heading toward the resistance at 112.35. Meanwhile, technical indicators show a possible continuation of the uptrend above 112.35. Meanwhile, the daily chart shows a continuation of the positive trend and is supported above 111.60. Technical indicators move neutrally.
Pivot Point: 112.00
| SUPPORT | RESISTANCE |
| 111.90 | 112.50 |
| 111.75 | 112.80 |
| 111.50 | 113.00 |
Sterling Pound (GBPUSD)
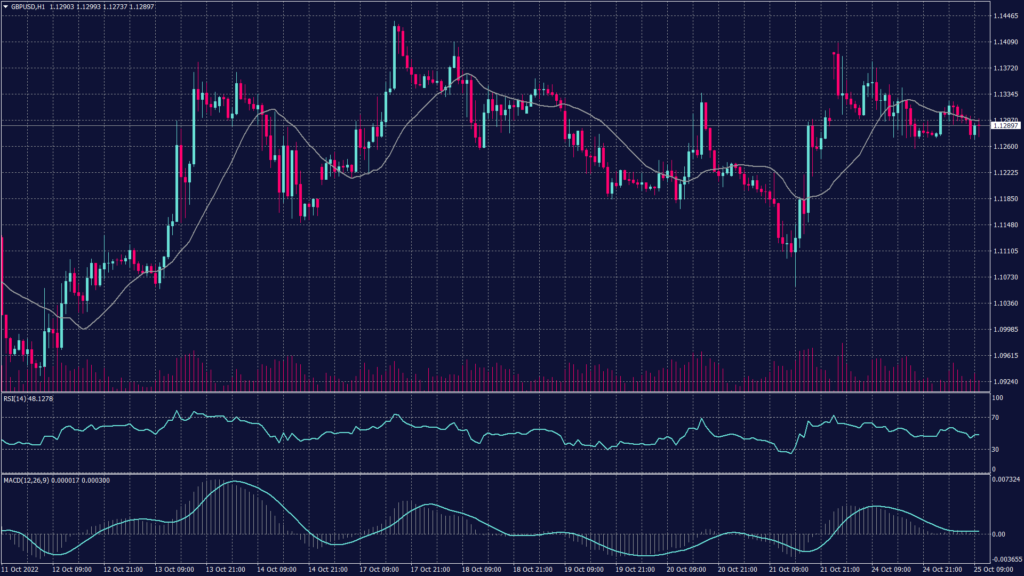
The Sterling Pound rebound may run out of steam as the challenges facing new Prime Minister Rishi Sunak have deepened. The Cable shed 0.2% to $1.1279 but remains well above its all-time low of $1.0327 seen last month. Sunak, who leans fiscally conservative, is expected to tighten fiscal policy further by hiking taxes or cutting government spending.
The pound remains inside the negatively trending channel despite the fluctuations above 1.1250. The hourly chart shows support at 1.1200 while the gap between 1.1180 and 1.1210 indicates weak momentum. On the other hand, the daily chart shows a continuation of the downtrend towards 1.0440
Pivot Point: 1.1300
| SUPPORT | RESISTANCE |
| 1.1270 | 1.1350 |
| 1.1200 | 1.1370 |
| 1.1130 | 1.1400 |
Spot Gold (XAUUSD)
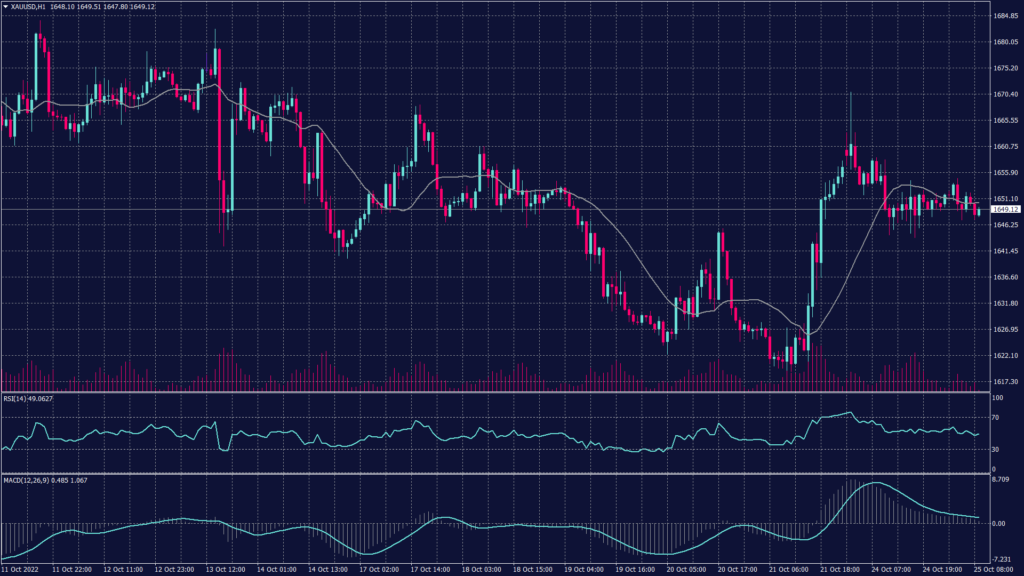
Gold prices were pressured near key support levels on Tuesday as the dollar steadied from recent losses, while copper prices retained recent losses amid growing concerns over slowing global economic growth. But gold and the greenback both remained within tight trading ranges seen in recent weeks, amid growing uncertainty over the path of U.S. monetary policy.
While hopes of a potential dovish tilt by the Federal Reserve somewhat benefited gold prices last week, markets are still pricing in a nearly 100% chance of a 75 basis point rate hike by the Fed in November. Spot gold prices rose 0.2% to $1,652.10 an ounce, while gold futures expiring in December also rose 0.2%. Bullion prices fell 0.6% on Monday as the dollar curbed recent losses.
Meanwhile, the daily chart remains within the downtrend channel heading towards 1,620 on the foreseen time frame.
Pivot Point: 1,645
| SUPPORT | RESISTANCE |
| 1,640 | 1,650 |
| 1,635 | 1,655 |
| 1,630 | 1,665 |
West Texas Crude (USOUSD)
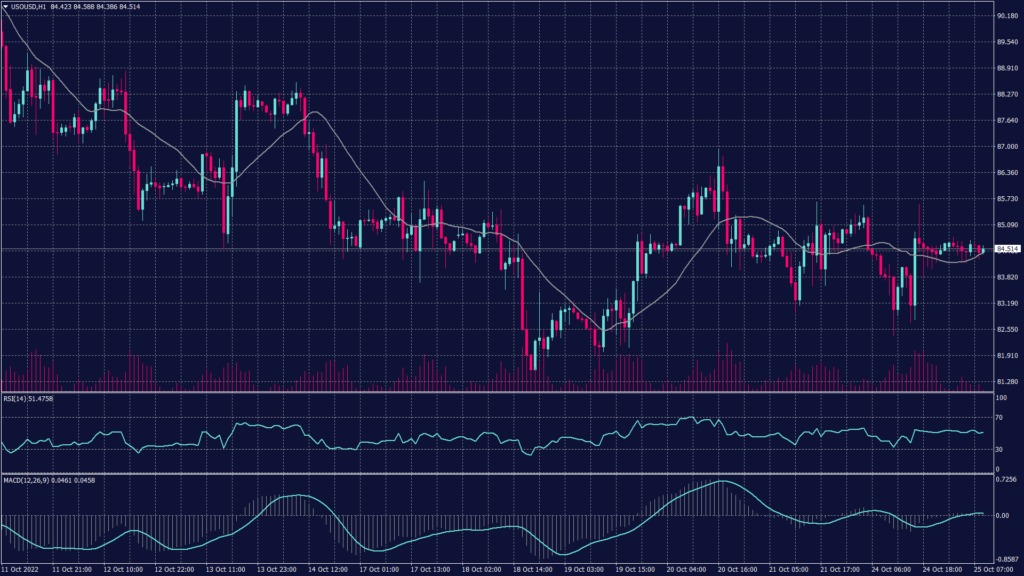
Oil prices rose on Tuesday as the U.S. dollar eased but gains were limited by worries of slowing global fuel demand growth amid bearish economic data from key oil-importing economies such as China. International benchmark Brent futures gained 0.2% to $93.53 per barrel while WTI futures rose 0.4% to $84.94 per barrel.
The WTI chart shows a downward trend on the daily chart while trading right above the support at 83.80. However, the technical indicators show a chance of fluctuations between 82.50 and 83.80 before deciding the actual trend. The hourly chart on the other hand is moving below the 20 and 50 periods moving average, indicating a high possibility of a negative trend continuation.
Pivot Point: 84.00
| SUPPORT | RESISTANCE |
| 82.15 | 84.50 |
| 81.30 | 84.70 |
| 79.50 | 85.70 |
Tags
Open Live Account
Please enter a valid country
No results found
No results found
Please enter a valid email
Please enter a valid verification code
1. 8-16 characters + numbers (0-9) 2. blend of letters (A-Z, a-z) 3. special characters (e.g, !a#S%^&)
Please enter the correct format
Please tick the checkbox to proceed
Please tick the checkbox to proceed
Important Notice
STARTRADER does not accept any applications from Australian residents.
To comply with regulatory requirements, clicking the button will redirect you to the STARTRADER website operated by STARTRADER PRIME GLOBAL PTY LTD (ABN 65 156 005 668), an authorized Australian Financial Services Licence holder (AFSL no. 421210) regulated by the Australian Securities and Investments Commission.
CONTINUEImportant Notice for Residents of the United Arab Emirates
In alignment with local regulatory requirements, individuals residing in the United Arab Emirates are requested to proceed via our dedicated regional platform at startrader.ae, which is operated by STARTRADER Global Financial Consultation & Financial Analysis L.L.C.. This entity is licensed by the UAE Capital Market Authority (CMA) under License No. 20200000241, and is authorised to introduce financial services and promote financial products in the UAE.
Please click the "Continue" button below to be redirected.
CONTINUEError! Please try again.

