


U.S. Dollar Index (USDX)
This morning, the U.S. dollar traded horizontally ay, and the reading is expected to show a further easing in growth from the prior quarter. Markets expect a potential slowdown in the world’s largest economy as the effects of tight monetary conditions begin to be felt.
Expectations of slower rate hikes have also dented the dollar and U.S. Treasury yields, but markets remain uncertain over where U.S. interest rates will peak, given that inflation is still trending near 40-year highs.
This week’s focus will also be on the Core Personal Consumption Expenditures index, the Federal Reserve’s preferred inflation gauge. While the index is expected to have eased in December from the prior month, it is still expected to remain well above the Fed’s 2% annual target.
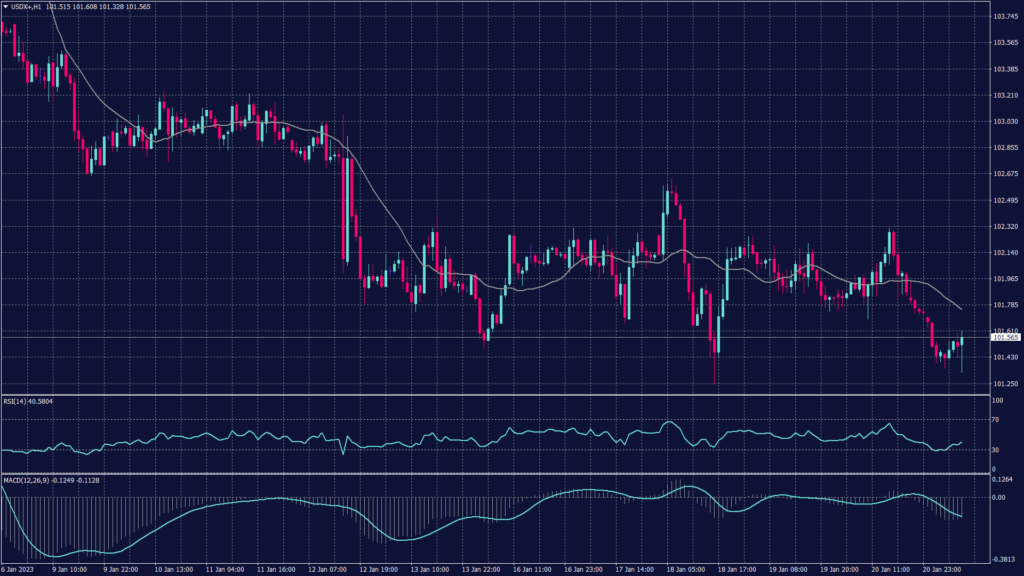
The dollar index trades under heavy selling pressure and remains committed to the downtrend that started in early November. Meanwhile, technical indicators show a neutral trend and move in a horizontal fashion.
Pivot Point: 101.40
| SUPPORT | RESISTANCE |
| 101.25 | 101.60 |
| 101.00 | 101.80 |
| 100.85 | 102.10 |
Euro (EURUSD)
The euro inched up to $1.0870 near its nine-month peak of $1.0888, opening the opportunity for a new high. The Common currency was aided by European Central Bank (ECB) governing council member Klaas Knot, who said interest rates would rise by 50 basis points in both February and March and continue climbing in the months after.
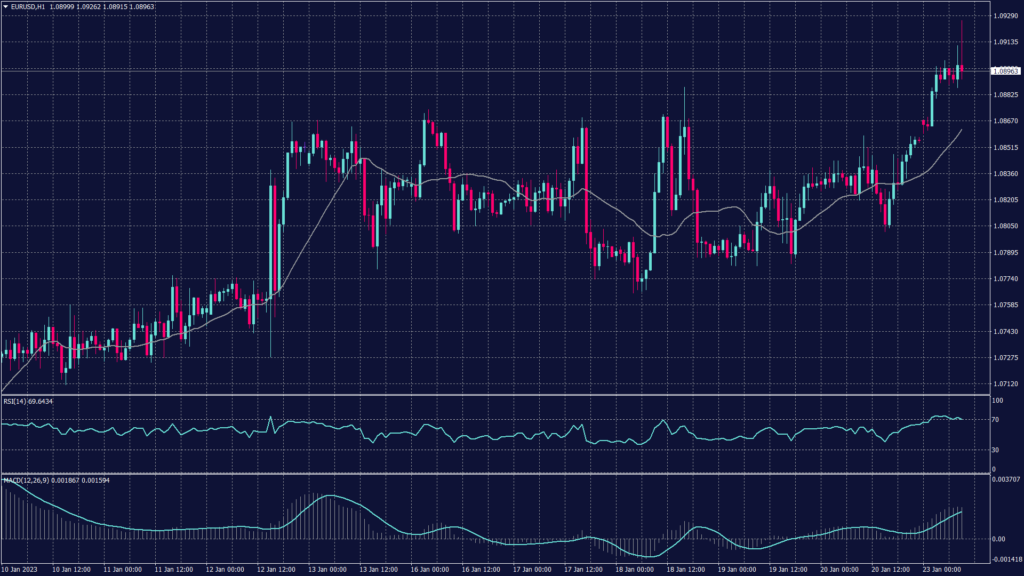
Technically, the pair is overbought, and it is showing a slowing momentum on the hourly chart. The technical indicators show a corrective range and signal a high chance of a decline toward 1.0830.
Pivot Point: 1.0900
| SUPPORT | RESISTANCE |
| 1.0875 | 1.0925 |
| 1.0800 | 1.0980 |
| 1.0760 | 1.1190 |
Spot Gold (XAUUSD)
Gold prices rose slightly this morning to trade near its nine-month high. Markets awaited more U.S. data this week to gauge whether the world’s largest economy was facing a potential recession in 2023. Trading volumes in metal markets were also relatively smaller at the beginning of the week, amid market holidays in several Asian countries.
Spot gold rose 0.2% to $1,928.95 an ounce, while gold futures rose 0.1% to $1,930.50 an ounce. Both instruments were trading close to their highest level since late April and were less than $100 away from record highs.
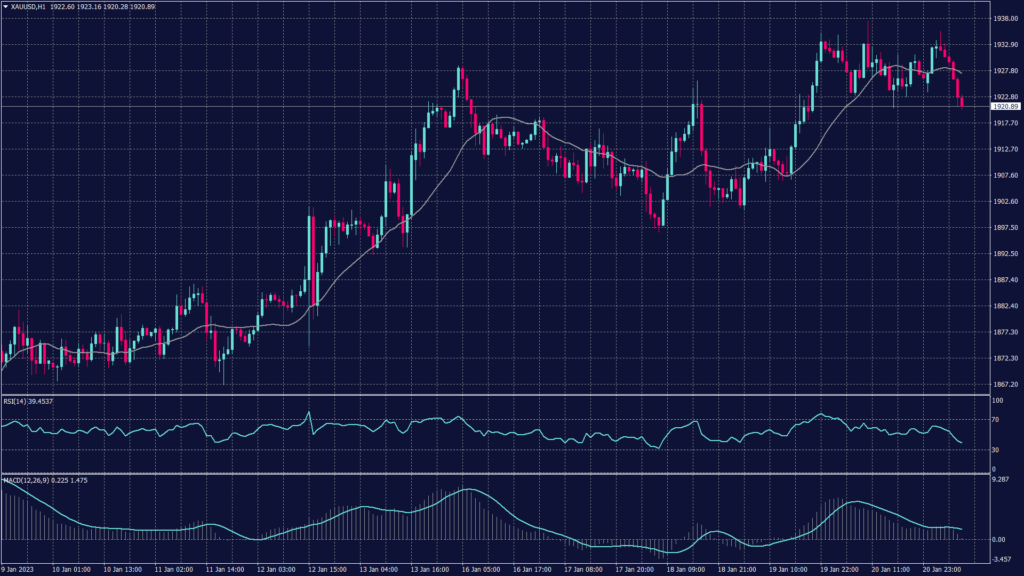
The daily chart shows a high possibility of breaking above 1,930. However, technical indicators show a slowing buying pressure below 1,930 on the daily chart. Meanwhile, the hourly chart shows fluctuations and high volatility between 1,920 and 1,930.
Pivot Point: 1,925
| SUPPORT | RESISTANCE |
| 1,920 | 1,930 |
| 1,912 | 1,935 |
| 1,905 | 1,940 |
WTI Futures (CL-OIL)
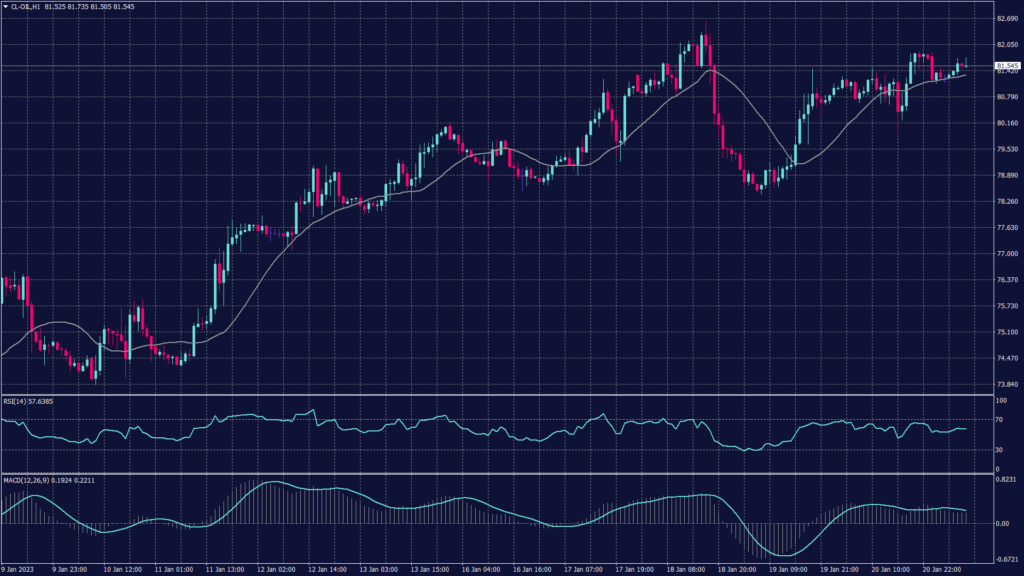
Oil prices edged lower from a recent rally on Monday, as traders awaited more cues on an economic recovery in China and a potential U.S. recession, although Asian trading volumes were slim amid a slew of market holidays in the region.
Brent futures fell 0.5% to $87.25 a barrel during the early Asian trade, while WTI futures fell 0.4% to $81.31 a barrel.
Pivot Point: 81.50
| SUPPORT | RESISTANCE |
| 80.10 | 81.70 |
| 79.40 | 82.60 |
| 78.45 | 83.50 |
Tags
Open Live Account
Please enter a valid country
No results found
No results found
Please enter a valid email
Please enter a valid verification code
1. 8-16 characters + numbers (0-9) 2. blend of letters (A-Z, a-z) 3. special characters (e.g, !a#S%^&)
Please enter the correct format
Please tick the checkbox to proceed
Please tick the checkbox to proceed
Important Notice
STARTRADER does not accept any applications from Australian residents.
To comply with regulatory requirements, clicking the button will redirect you to the STARTRADER website operated by STARTRADER PRIME GLOBAL PTY LTD (ABN 65 156 005 668), an authorized Australian Financial Services Licence holder (AFSL no. 421210) regulated by the Australian Securities and Investments Commission.
CONTINUEImportant Notice for Residents of the United Arab Emirates
In alignment with local regulatory requirements, individuals residing in the United Arab Emirates are requested to proceed via our dedicated regional platform at startrader.ae, which is operated by STARTRADER Global Financial Consultation & Financial Analysis L.L.C.. This entity is licensed by the UAE Capital Market Authority (CMA) under License No. 20200000241, and is authorised to introduce financial services and promote financial products in the UAE.
Please click the "Continue" button below to be redirected.
CONTINUEError! Please try again.

