








 Web Trader MT5









Bitcoin Technical Analysis
Bitcoin is currently trading around $68,340 after failing to sustain gains above the $70,000 psychological resistance zone. Price structure shows a clear lower high formation following rejection near $71,000, confirming short-term bearish pressure.
The moving averages (5, 10, 30) are beginning to roll over. Price is now trading below the short-term moving averages and pressing toward the 30-period moving average, which is flattening.
MACD confirms the loss of momentum. The MACD line is below the signal line. Although bearish momentum is not accelerating aggressively, it remains dominant.
Key support sits at $67,800–$68,000. A clean break below this area exposes $66,500, followed by the previous swing low near $65,100. On the upside, buyers must reclaim $69,500 first, then $71,000 to resume the bullish structure.
Bitcoin 1H Chart
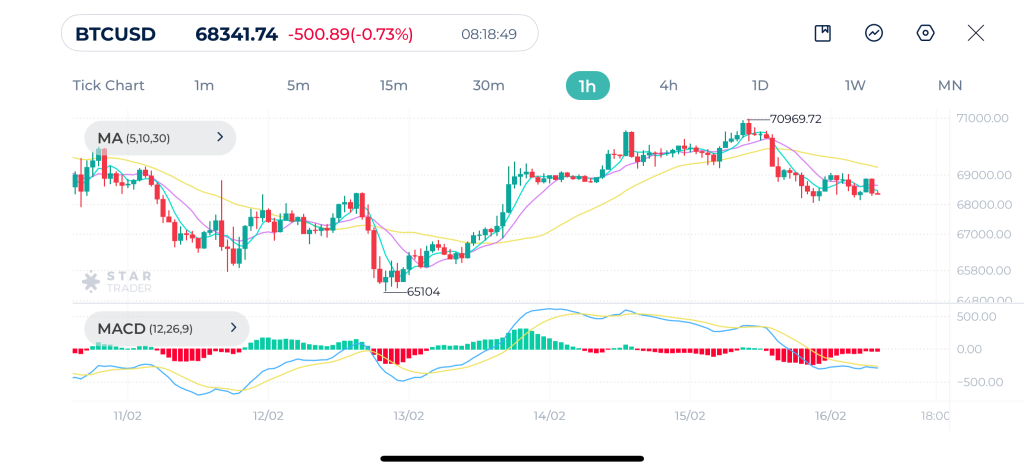
| Resistance | $69,047 | $69,964 | $70,943 |
| Support | $68,062 | $67,273 | $66,740 |
Gold Technical Analysis
Gold is trading around $4,980 after failing to sustain above the $5,000 psychological level. The structure shows a sharp bearish impulse, followed by a corrective rebound that is now losing strength.
Price is hovering near the short term moving averages, but the 30-period moving average is slightly downward sloping. The shorter moving averages are compressing, signaling consolidation after volatility.
MACD shows that bearish momentum peaked during the selloff and has since faded.
Support is located at $4,950–$4,960. A break below that opens $4,920 again. Resistance stands at $5,020, then $5,100–$5,120. Only a sustained move above $5,120 would restore strong bullish momentum.
Gold 1H Chart
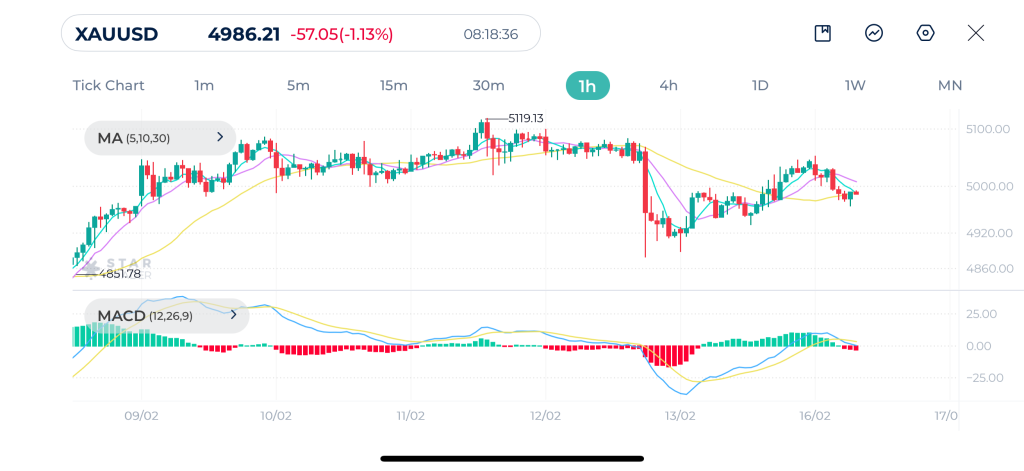
| Resistance | $5,031 | $5,082 | $5,119 |
| Support | $4,964 | $4,933 | $4,905 |
EURUSD Technical Analysis
EURUSD is trading near 1.1866 after a strong rally tin January. The pair is currently in a consolidation phase following that impulsive breakout.
Price remains above the 30-period moving average, and the short-term moving averages are still positively aligned, although momentum has slowed. The structure shows higher lows, which keeps the short term bullish bias intact.
MACD shows momentum cooling after the strong bullish impulse. Support sits at 1.1820–1.1840. A break below that exposes 1.1765. Resistance remains at 1.2000, then 1.2080. A breakout above 1.2080 would likely trigger another impulsive leg higher.
EURUSD 1H Chart
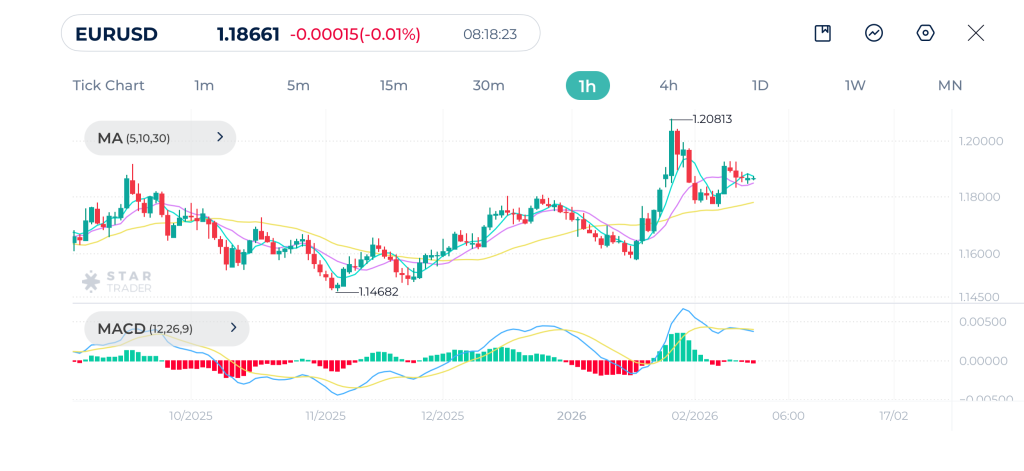
| Resistance | 1.1885 | 1.9000 | 1.1915 |
| Support | 1.1847 | 1.1822 | 1.1800 |
Tags


Open Live Account
 Email Address
 Phone Number
Important Notice
STARTRADER does not accept any applications from Australian residents.
To comply with regulatory requirements, clicking the button will redirect you to the STARTRADER website operated by STARTRADER PRIME GLOBAL PTY LTD (ABN 65 156 005 668), an authorized Australian Financial Services Licence holder (AFSL no. 421210) regulated by the Australian Securities and Investments Commission.
Important Notice for Residents of the United Arab Emirates
In alignment with local regulatory requirements, individuals residing in the United Arab Emirates are requested to proceed via our dedicated regional platform at startrader.ae, which is operated by STARTRADER Global Financial Consultation & Financial Analysis L.L.C.. This entity is licensed by the UAE Capital Market Authority (CMA) under License No. 20200000241, and is authorised to introduce financial services and promote financial products in the UAE.
Please click the "Continue" button below to be redirected.


