


Australia saw a large spike in inflation this year as the country rolled back most COVID-era restrictions. But the aftermath of COVID-era stimulus measures also factored heavily into rising prices.
Biden announced a plan last week to sell off the rest of a record release from the nation’s emergency oil reserve by year end as he tries to dampen high gasoline prices. In the interim, a stronger dollar also weighed on the market on Wednesday.
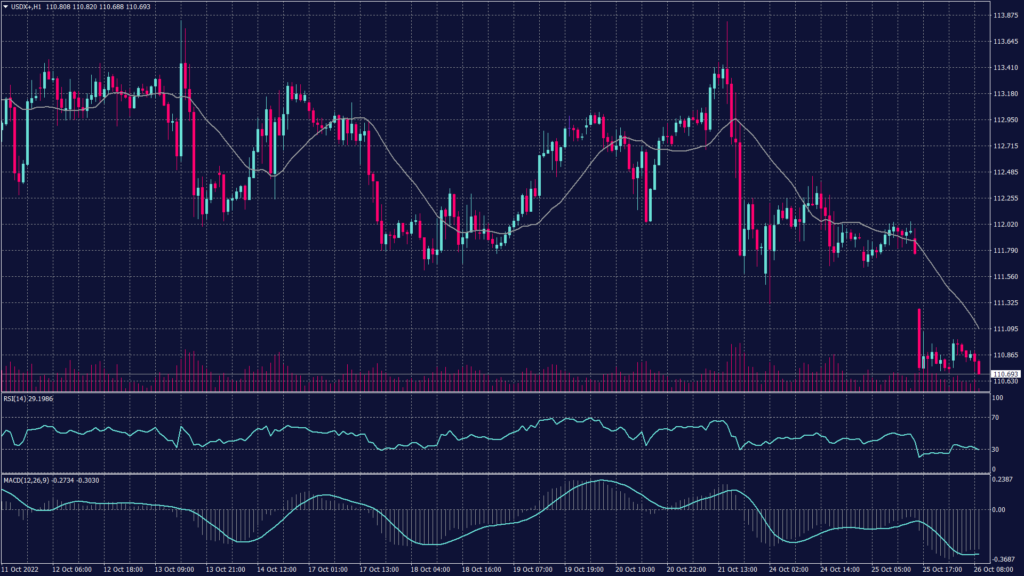
U.S. Dollar Index (USDX)
The dollar index was unchanged after falling more than 2% over the past four sessions. U.S. Treasury yields also fell further from 14-year highs, amid growing speculation that the Fed intends to soften its policy stance by December.
While markets expect an at least 75 basis point hike by the Fed in November, expectations of a smaller hike in December are now growing. Rising interest rates boosted the dollar to 20-year highs this year and weighed heavily on Asian markets.
The dollar index drops below the support level at 110.80 after the gap down this morning while Fibonacci retracement shows a continuation of the decline on the hourly chart. However, technical indicators show negative momentum and diversion towards the selling activities.
Meanwhile, the daily chart shows further decline towards 110.20 which will most likely indicate a continuation to the correction trend. Technical indicators show similar signals as the hourly chart with strong selling pressure. However, breaking the support at 110.20 will be a signal to target 108.50.
Pivot Point: 110.60
| SUPPORT | RESISTANCE |
| 110.40 | 110.90 |
| 109.90 | 111.30 |
| 108.50 | 111.70 |
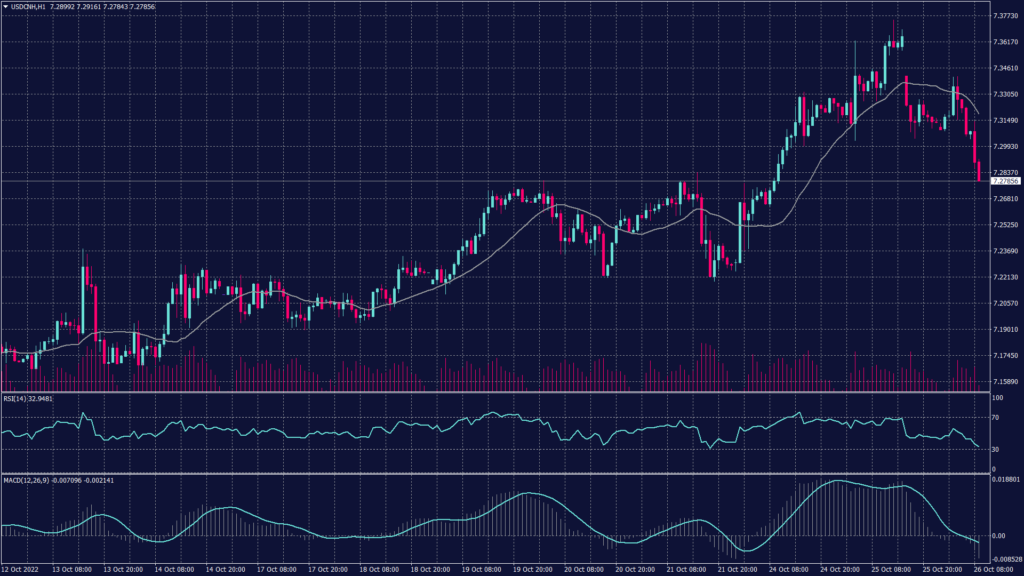
Chinese Yuan (USDCNH)
Most Asian currencies crept higher on Wednesday as markets bet that economic headwinds will force the Federal Reserve into softening its hawkish stance, while the Chinese yuan rose amid reports of government intervention in currency markets.
The yuan rose 0.2% to 7.2892, recovering from a near 15-year low. Reuters reported that major Chinese state-owned banks sold dollars to support both the onshore and offshore yuan amid recent weakness in the currency.
Concerns over China’s political climate saw the yuan fall sharply this week, with the offshore currency hitting a record low. Markets were also underwhelmed by third-quarter GDP data that fell below the People’s Bank of China’s guidance. Meanwhile, investors were wary of any more disruptive policies from China, after Beijing reiterated its commitment to maintaining its strict zero-COVID policy.
The hourly chart shows a continuation of the decline towards 7.2540 while Fibonacci retracement targets 7.2020 if it broke below 7.2540. Meanwhile, technical indicators show a possible continuation as MACD shows a diversion and RSI shows high selling pressure.
Pivot Point: 7.2720
| SUPPORT | RESISTANCE |
| 7.2540 | 7.2800 |
| 7.2320 | 7.2910 |
| 7.2020 | 7.2995 |
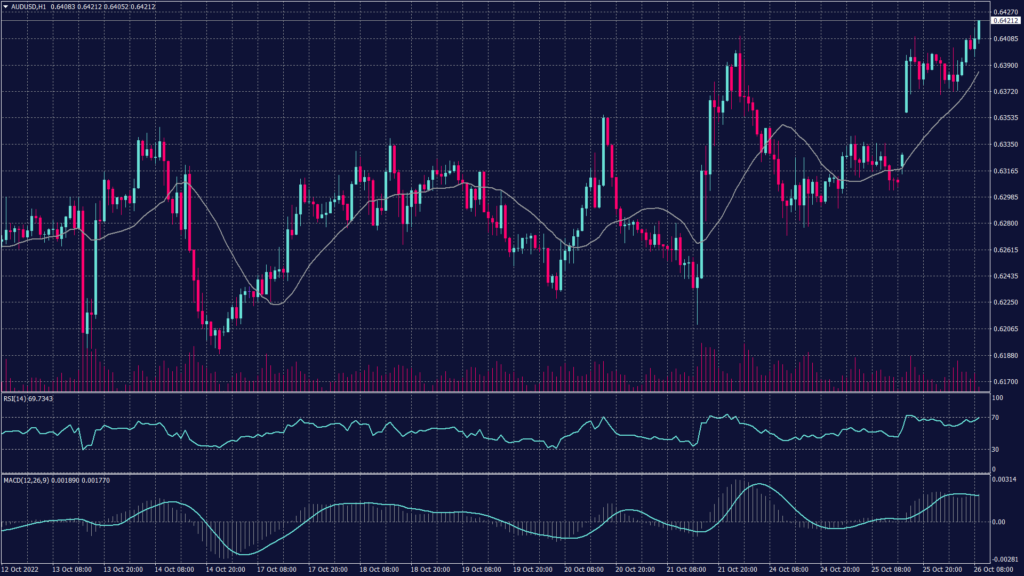
Australian Dollar (AUDUSD)
Australian inflation rose more than expected in the September quarter, hitting a 32-year high and likely inviting more interest rate hikes by the Reserve Bank to control rising price pressures.
The Consumer Price Index rose 1.8% in the three months to September 30 from the prior quarter, data from the Australian Bureau of Statistics (ABS) showed on Wednesday. The reading was higher than expectations for a rise of 1.6% and remained steady from last quarter’s figure of 1.8%.
On an annualized basis, CPI inflation rose 7.3% as of the quarter-end, more than expectations for growth of 7.0% and the previous quarter’s reading of 6.1%. The reading was also Australia’s fastest growth in annual inflation since 1990.
Pivot Point: 0.6435
| SUPPORT | RESISTANCE |
| 0.6380 | 0.6475 |
| 0.6350 | 0.6415 |
| 0.6295 | 0.6550 |
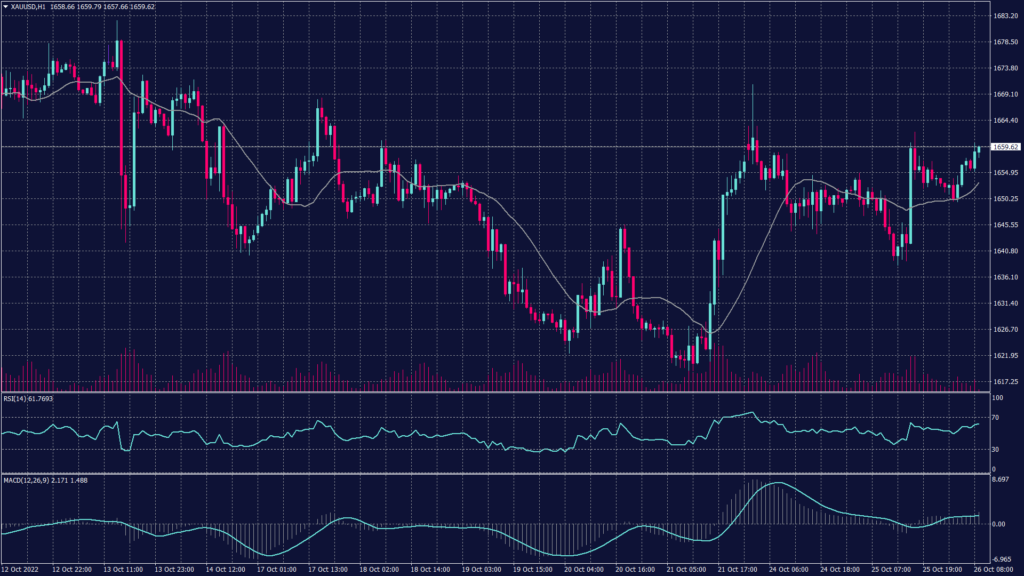
Spot Gold (XAUUSD)
Metal markets took little support from a weakening US Dollar Index, as concerns over a slowdown in most major economies sapped appetite. The prospect of a sharp interest rate hike by the Federal Reserve next month also kept traders on edge. Spot gold fell 0.1% to $1,651.76 an ounce, while gold futures fell 0.1% to $1,655.85 an ounce. Both instruments rose slightly on Tuesday but were pinned to $1,650- a closely-watched support level.
Bullion prices plummeted from annual highs this year and are now trading in a two-year trough, as rising interest rates ramped up the opportunity cost of holding the yellow metal. Gold has also largely lost its safe haven status this year, with the U.S. dollar racing past the metal.
Gold prices remain positive to break above the resistance at 1,665 and targeting 1,670 on the hourly chart. Despite the signal from RSI that shows a slowdown in the momentum, MACD shows a possible continuation of the uptrend. Meanwhile, the daily chart remains within the downtrend channel heading towards 1,620 on the foreseen time frame.
Pivot Point: 1,665
| SUPPORT | RESISTANCE |
| 1,660 | 1,670 |
| 1,655 | 1,675 |
| 1,650 | 1,679 |
West Texas Crude (USOUSD)
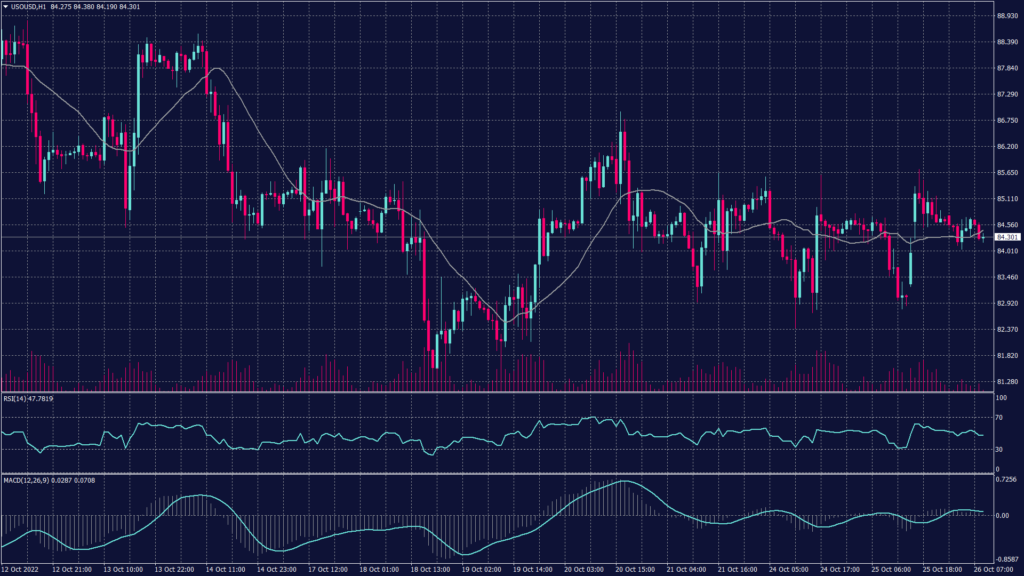
Oil prices eased after industry data showed stockpiles rose more than expected, but losses were capped by supply worries. Brent fell 0.8% to $92.80 a barrel, while WTI shed 0.6% to $84.84. Both benchmarks have reversed the gains recorded in the previous session.
U.S. crude inventories rose by about 4.5 million barrels in the week ended October 21, according to market sources citing figures from the American Petroleum Institute. While a rise in crude stockpiles reinforced fears of a global recession that would cut demand, ongoing supply constraints kept prices trading in a narrow range. Meanwhile, official U.S. stockpile data from the government’s Energy Information Administration is due later in the day.
The WTI chart shows a downward trend on the daily chart while trading right above the support at 83.80. However, the technical indicators show a chance of fluctuations between 82.50 and 83.80 before deciding the actual trend. The hourly chart on the other hand is moving below the 20 and 50 periods moving average, indicating a high possibility of a negative trend continuation.
Pivot Point: 84.00
| SUPPORT | RESISTANCE |
| 82.15 | 84.50 |
| 81.30 | 84.70 |
| 79.50 | 85.70 |
Tags
Open Live Account
Please enter a valid country
No results found
No results found
Please enter a valid email
Please enter a valid verification code
1. 8-16 characters + numbers (0-9) 2. blend of letters (A-Z, a-z) 3. special characters (e.g, !a#S%^&)
Please enter the correct format
Please tick the checkbox to proceed
Please tick the checkbox to proceed
Important Notice
STARTRADER does not accept any applications from Australian residents.
To comply with regulatory requirements, clicking the button will redirect you to the STARTRADER website operated by STARTRADER PRIME GLOBAL PTY LTD (ABN 65 156 005 668), an authorized Australian Financial Services Licence holder (AFSL no. 421210) regulated by the Australian Securities and Investments Commission.
CONTINUEImportant Notice for Residents of the United Arab Emirates
In alignment with local regulatory requirements, individuals residing in the United Arab Emirates are requested to proceed via our dedicated regional platform at startrader.ae, which is operated by STARTRADER Global Financial Consultation & Financial Analysis L.L.C.. This entity is licensed by the UAE Capital Market Authority (CMA) under License No. 20200000241, and is authorised to introduce financial services and promote financial products in the UAE.
Please click the "Continue" button below to be redirected.
CONTINUEError! Please try again.

