


MARKET NEWS SUMMARY
Euro (EURUSD)
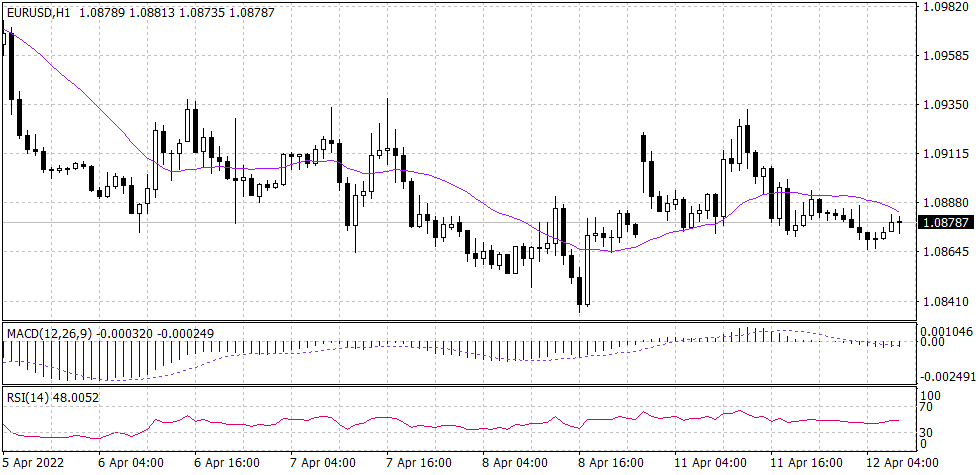
In the daily time frame, the Euro is trading around the level of the previous hammer candle closed on Friday near 1.0880. Meanwhile, in the hourly chart, the pair is trading green for the last three trading hours, closing to the 20 candles moving average near 1.0886 at the time of writing. It is believed that the correction will result in touching the level of 1.0900, however, the technical indicators views vary. The MACD, the intersection between the moving average line and the mainline is confirming more gain, while the RSI is fluctuating neutral between 42 and 47.
PIVOT POINT: 1.0880
| S1 | S2 | S3 | |
| SUPPORT | 1.0870 | 1.0820 | 1.0770 |
| R1 | R2 | R3 | |
| RESISTANCE | 1.0900 | 1.0980 | 1.0110 |
Sterling pound (GBPUSD)
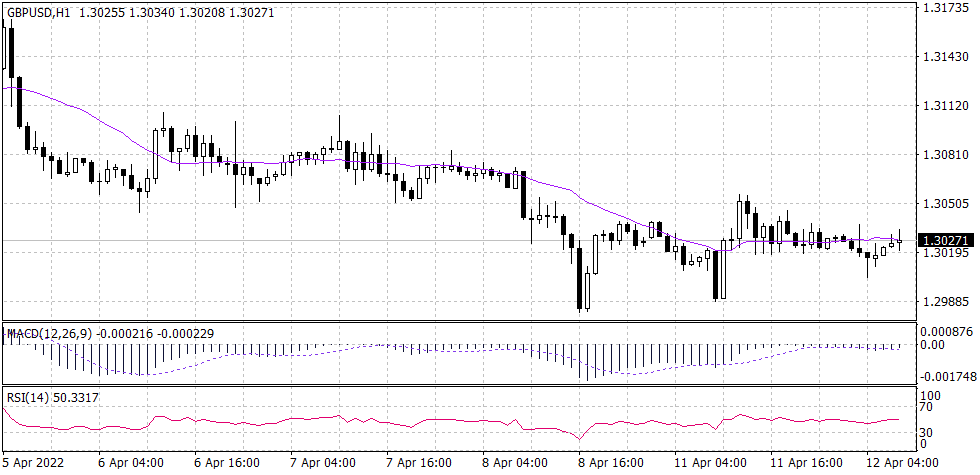
The Cable remains in the downwards trend started in May 2021. Furthermore, it reached a so seen support level on the daily chart near 1.3020 where it did close near for the past three trading days. Reading the intraday chart, the sterling pound pair fluctuates in a slow horizontal range affected by the fundamental news in the market. Technical indicators look indecisive, indicating a careful and uncertain trading session.
PIVOT POINT: 1.3027
| S1 | S2 | S3 | |
| SUPPORT | 1.3010 | 1.2980 | 1.2970 |
| R1 | R2 | R3 | |
| RESISTANCE | 1.3040 | 1.3060 | 1.3090 |
S&P 500 (SPX500)
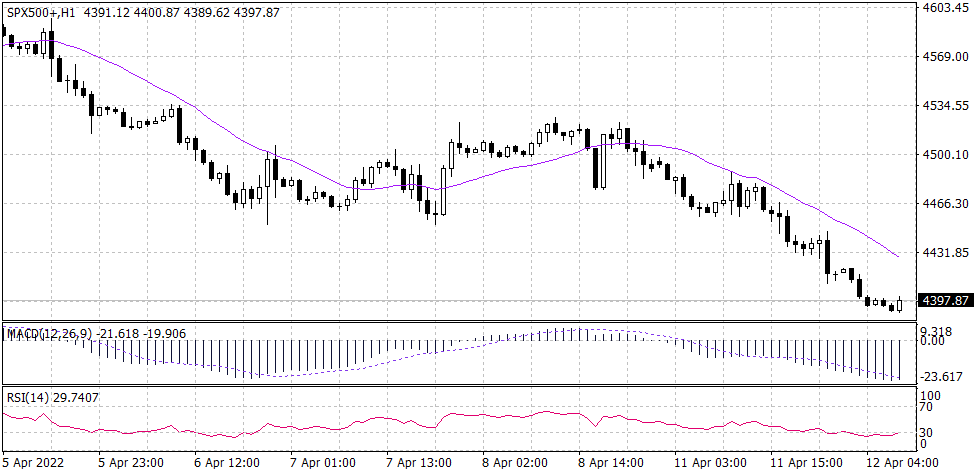
The U.S. flagship retains its long-term plateau that started after the big run for the past few years. It is believed that this movement is a distribution phase before a bearish run. However, in the intraday chart, the SP500 continues its bearish trend that started in late March reaching near 4,390. With the gap between the current price level and the 20 candles moving average widening, the bearish trend is unlikely to break anytime soon. MACD is showing a parallel movement between the MACD line and the signal line, while the RSI is closing to the 30 which is a neutral level indicating uncertainty.
PIVOT POINT: 4,435
| S1 | S2 | S3 | |
| SUPPORT | 4,420 | 4,400 | 4,385 |
| R1 | R2 | R3 | |
| RESISTANCE | 4,445 | 4,475 | 4,490 |
Spot gold (XAUUSD)
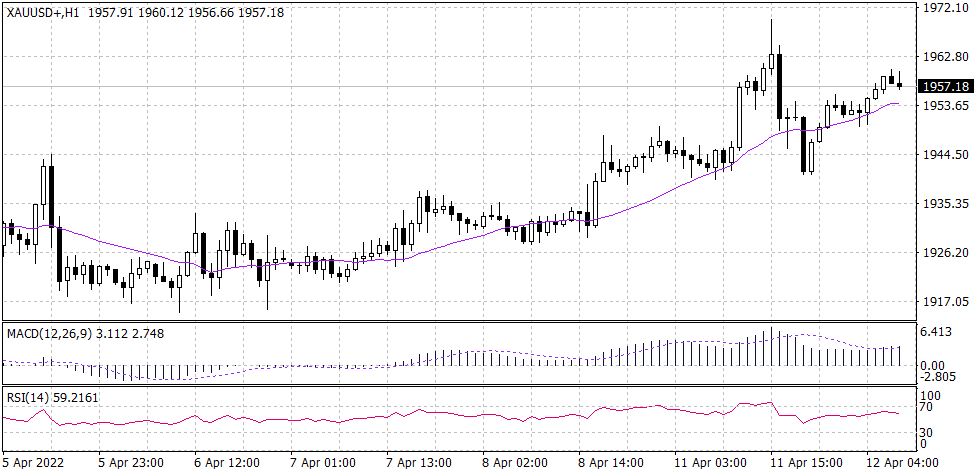
On the daily chart, it can be seen that the spot gold is forming a fail-safe level at $1,920, the precious metal touched this support level 14 times in the last 30 days. After losing $20 yesterday, the yellow metal bounces back to $1,960 at the time of drafting this report. MACD is showing a swing in the daily trend. Nevertheless, the RSI is indicating that the metal is trading close to the over buying levels and indicating a possible swing below $1,965.
PIVOT POINT: 1,957
| S1 | S2 | S3 | |
| SUPPORT | 1,950 | 1,945 | 1,942 |
| R1 | R2 | R3 | |
| RESISTANCE | 1,965 | 1,971 | 1,975 |
Spot WTI (USOUSD)
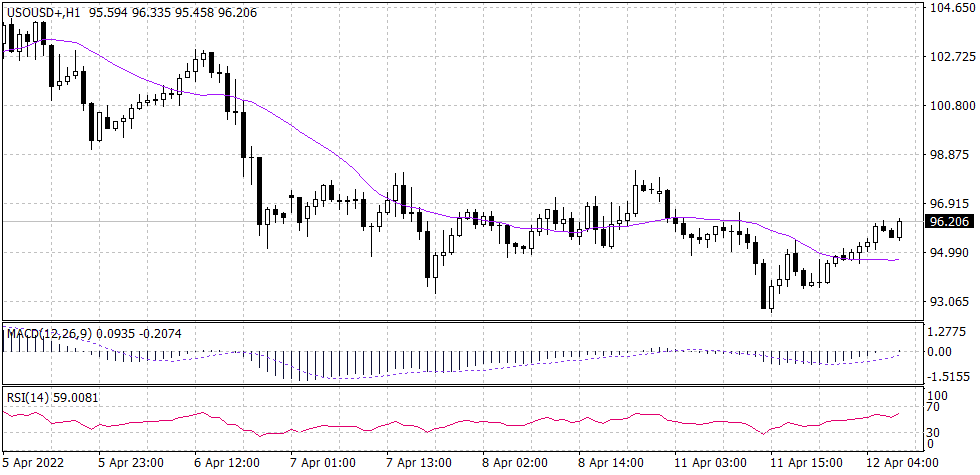
Crude oil prices remain in their downward trend that started on March 24th without major corrections or secondary trends. Furthermore, crude oil looks like having a challenging time gaining momentum due to the geopolitical events and the global fundamentals. Technically, the WTI started the day in a $1 green hourly candle before slipping $0.5 in the next two hours. However, technical indicators do not show any signals of an upward trend. West Texas crude is trading above the 20 candles moving average, while the RSI and MACD are showing a possible slip to reduce the buying pressure seen in the flat candle seen mid-day yesterday.
PIVOT POINT: 96.00
| S1 | S2 | S3 | |
| SUPPORT | 95.50 | 95.10 | 94.10 |
| R1 | R2 | R3 | |
| RESISTANCE | 97.20 | 98.50 | 99.80 |
Tags
Open Live Account
Please enter a valid country
No results found
No results found
Please enter a valid email
Please enter a valid verification code
1. 8-16 characters + numbers (0-9) 2. blend of letters (A-Z, a-z) 3. special characters (e.g, !a#S%^&)
Please enter the correct format
Please tick the checkbox to proceed
Please tick the checkbox to proceed
Important Notice
STARTRADER does not accept any applications from Australian residents.
To comply with regulatory requirements, clicking the button will redirect you to the STARTRADER website operated by STARTRADER PRIME GLOBAL PTY LTD (ABN 65 156 005 668), an authorized Australian Financial Services Licence holder (AFSL no. 421210) regulated by the Australian Securities and Investments Commission.
CONTINUEImportant Notice for Residents of the United Arab Emirates
In alignment with local regulatory requirements, individuals residing in the United Arab Emirates are requested to proceed via our dedicated regional platform at startrader.ae, which is operated by STARTRADER Global Financial Consultation & Financial Analysis L.L.C.. This entity is licensed by the UAE Capital Market Authority (CMA) under License No. 20200000241, and is authorised to introduce financial services and promote financial products in the UAE.
Please click the "Continue" button below to be redirected.
CONTINUEError! Please try again.

