


market news summary
U.S. Dollar Index (USDX)
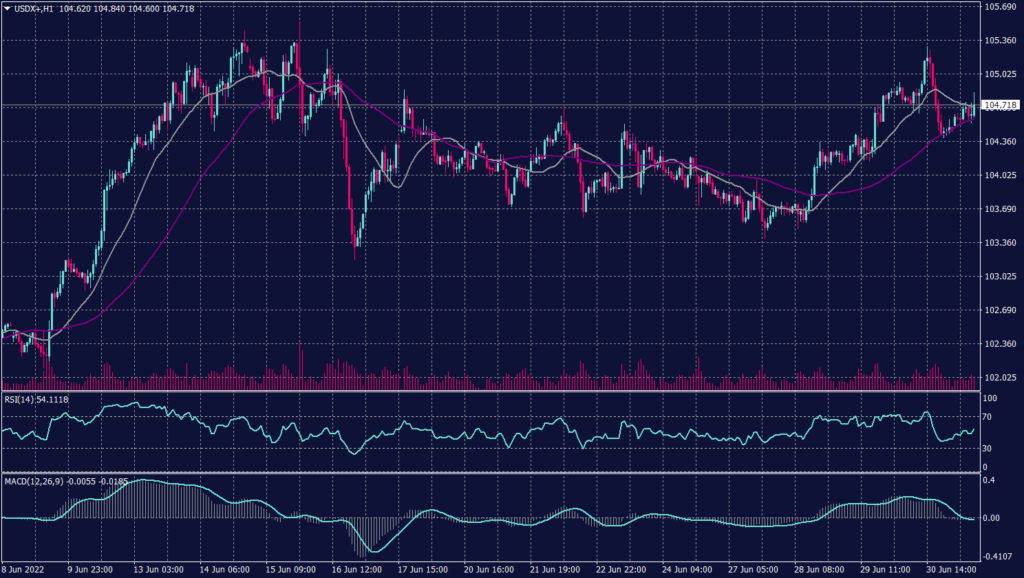
The dollar index slid 0.32% overnight after the spending data, only to rally on Friday as that same data drove declines in Asian equities. Additionally, the dollar index is on track for a 0.75% gain, which would be its best week in four.
The Fed has lifted the policy rate by 150 basis points since March, with half of that coming last month in the central bank’s biggest hike since 1994. The market is betting on another of the same magnitude at the end of this month.
Technically:
The daily chart indicates a continuation of the uptrend in the long term towards a new all time high. Technical indicators can’t confirm the continuation while moving averages show horizontal signals. The hourly chart shows an upward movement but keeps the tendency for a decline.
PIVOT POINT: 104.60
| SUPPORT | RESISTANCE |
| 104.40 | 105.00 |
| 104.00 | 105.30 |
| 103.60 | 105.40 |
Euro (EURUSD)
European Central Bank President Christine Lagarde warned in a speech at the central bank’s annual forum earlier this week that the central bank will go “as far as necessary” to bring inflation back down to its 2% target.
The focus will be on Eurozone consumer price data, due later Friday, with investors looking for signs that inflation has peaked. German inflation unexpectedly slowed last month, but the annual CPI for the euro bloc is expected to climb to 8.4% in June, a new record after it reached 8.1% the previous month.
Additionally, manufacturing PMI data for the Eurozone, and especially Germany, the region’s powerhouse, are also due Friday and are expected to show deteriorating confidence in this key sector.
Technically:
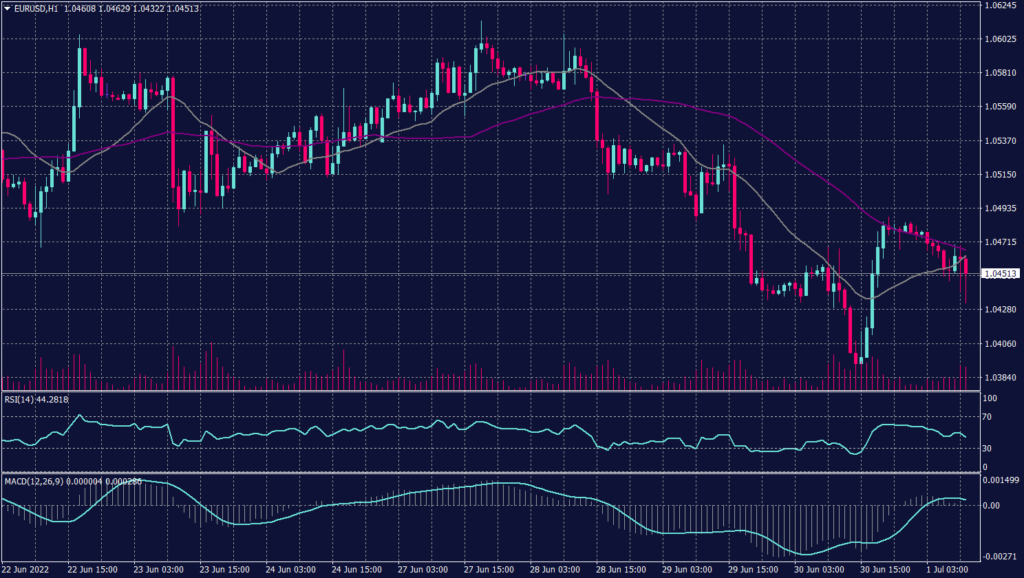
The Euro pair remains drowning overall despite the support above 1.0400 and the swing above 1.0470. Meanwhile, on the hourly chart, the EURUSD traded upwards this morning bouncing from two weeks low. The pair show shows for decline continuation towards 1.0375 and technical indicators confirm the signal.
PIVOT POINT: 1.0440
| SUPPORT | RESISTANCE |
| 1.0375 | 1.0480 |
| 1.0320 | 1.0510 |
| 1.0280 | 1.0530 |
Spot Gold (XAUUSD)
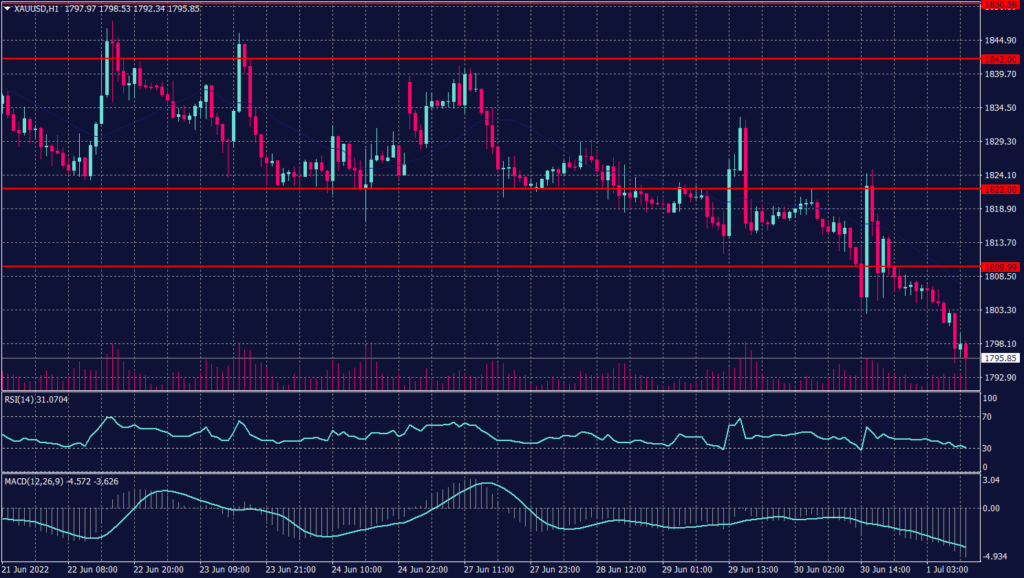
Gold broke below the support at $1,800 which confirms a drop towards $1,785. The daily chart, however, show a continuation of the negative trend towards $1,750 unless the prices pounced to 1,840, which is technically not as easy as the decline.
PIVOT POINT: 1,792
| SUPPORT | RESISTANCE |
| 1,785 | 1,800 |
| 1,763 | 1,820 |
| 1,750 | 1,842 |
West Texas Crude (USOUSD)
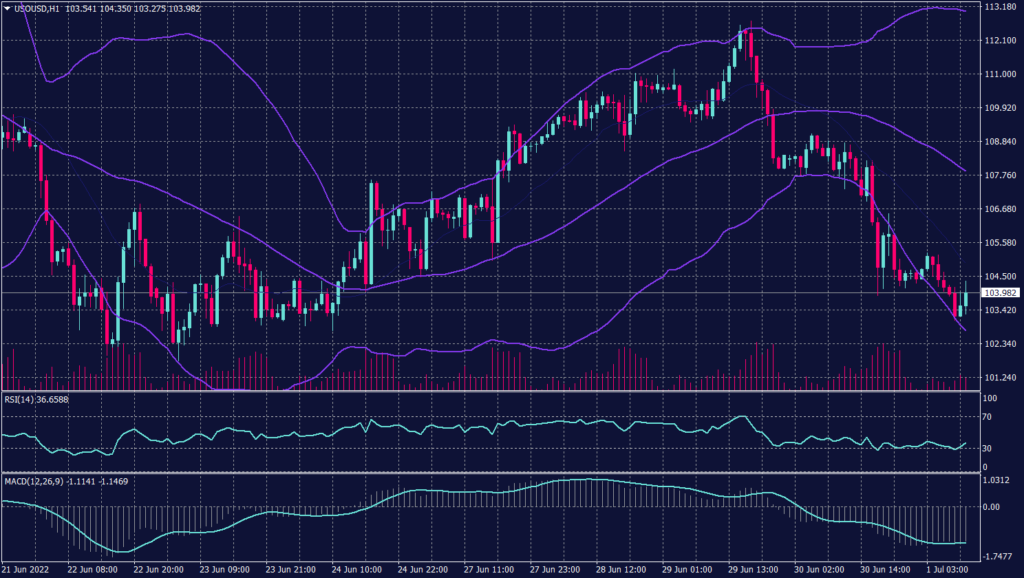
Oil prices eased on Friday as lingering fears of a recession demand weighed on sentiment, putting the benchmarks on track for their third straight weekly losses. Brent crude futures were down 0.2%t $108.83 while WTI crude futures 0.4% to $105.39. Both contracts fell around 3% on Thursday.
On Thursday, the OPEC+ group of producers, including Russia, agreed to stick to its output strategy after two days of meetings. However, the producer club avoided discussing policy from September onwards. Previously, OPEC+ decided to increase output each month by 648,000 barrels per day (bpd) in July and August, up from a previous plan to add 432,000 bpd per month.
Technically:
On the hourly chart, WTI prices show a decrease in volume traded due to the worries about the G-7 decision regarding the Russian sanctions. However, the daily chart confirms the high probability of the decline and targets $98 a barrel before any serious gains happens.
PIVOT POINT: 104.50
| SUPPORT | RESISTANCE |
| 103.40 | 105.20 |
| 102.20 | 109.50 |
| 100.00 | 111.00 |
Tags
Open Live Account
Please enter a valid country
No results found
No results found
Please enter a valid email
Please enter a valid verification code
1. 8-16 characters + numbers (0-9) 2. blend of letters (A-Z, a-z) 3. special characters (e.g, !a#S%^&)
Please enter the correct format
Please tick the checkbox to proceed
Please tick the checkbox to proceed
Important Notice
STARTRADER does not accept any applications from Australian residents.
To comply with regulatory requirements, clicking the button will redirect you to the STARTRADER website operated by STARTRADER PRIME GLOBAL PTY LTD (ABN 65 156 005 668), an authorized Australian Financial Services Licence holder (AFSL no. 421210) regulated by the Australian Securities and Investments Commission.
CONTINUEImportant Notice for Residents of the United Arab Emirates
In alignment with local regulatory requirements, individuals residing in the United Arab Emirates are requested to proceed via our dedicated regional platform at startrader.ae, which is operated by STARTRADER Global Financial Consultation & Financial Analysis L.L.C.. This entity is licensed by the UAE Capital Market Authority (CMA) under License No. 20200000241, and is authorised to introduce financial services and promote financial products in the UAE.
Please click the "Continue" button below to be redirected.
CONTINUEError! Please try again.

