


Those who have tracked the S&P 500 trend over the past 70 years would’ve noticed a cycle – S&P 500 hits a new high, the Fed intervenes, inflation booms, S&P 500 crashes, and then we find ourselves in the middle of a crisis.
The First 20 Years: The Great Depression
The S&P 500 was initiated in 1957, at 386.36 points. Throughout its first decade, the value of the index rose to almost double, signifying the economic blast that followed World War II and reaching near 700 points. Over the next decade, the Fed eased its fiscal policy to push economic growth. But as a result, the S&P 500 dipped by more than 50% to under 300 points and the Great Depression began—the worst economic downturn in the 20th century since World War II. Therefore, the S&P 500 shed another 20% during the time between 1981 through 1982 to 111.59 points.
The second big hit: The Tech bubble
It took nearly 30 years of economic recovery and technological inventions to encourage Tech companies to shine. In 2000, the stock market faced the Tech bubble or so-called Overvaluation Bubble. This era was marked by overvaluations, increasing popularity of equity trading, and a heavy focus on Tech shares—back then you could watch equity news in your neighbourhood grocery shop or even discuss it with your cab driver. When the bubble burst in 2002, the new-born index NASDAQ dipped almost 90%, while 40% of S&P 500 value vanished, moreover the majority of common traders’ wealth.
Without warning: The Great Recession
Eventually, the S&P 500 recovered reaching new highs in 2007 stoked by the increase in housing, financial sector growth, and gaining commodity stocks. However, in 2008, the majority of these gains were repealed after a decline in housing prices and increasing numbers of housing loans defaults. The country-wide debt defaults created an environment of intense fear, and distrust of equities as a sound investment. The S&P 500 fell 57.7% recording its largest drop in history. Starting at its high of 1,576.09 in October 2007 bottoming out in 2009 at 666.79 points during what has come to be known as the Great Recession.
Nowadays: Current events in the same old order
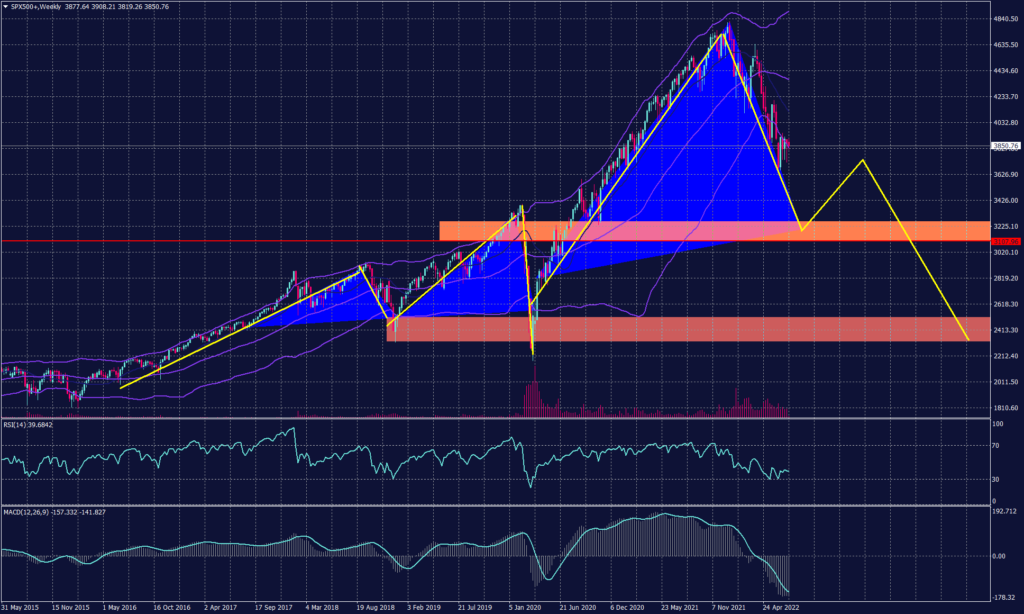
Look at the current year; S&P 500 hit new all-time high early and started falling, central banks planning for rate hikes, and commodities prices are going rocket high.
Are we running into the same wheel? Will S&P 500 lose more of its value? When? And to what extent?
Tags
Open Live Account
Please enter a valid country
No results found
No results found
Please enter a valid email
Please enter a valid verification code
1. 8-16 characters + numbers (0-9) 2. blend of letters (A-Z, a-z) 3. special characters (e.g, !a#S%^&)
Please enter the correct format
Please tick the checkbox to proceed
Please tick the checkbox to proceed
Important Notice
STARTRADER does not accept any applications from Australian residents.
To comply with regulatory requirements, clicking the button will redirect you to the STARTRADER website operated by STARTRADER PRIME GLOBAL PTY LTD (ABN 65 156 005 668), an authorized Australian Financial Services Licence holder (AFSL no. 421210) regulated by the Australian Securities and Investments Commission.
CONTINUEImportant Notice for Residents of the United Arab Emirates
In alignment with local regulatory requirements, individuals residing in the United Arab Emirates are requested to proceed via our dedicated regional platform at startrader.ae, which is operated by STARTRADER Global Financial Consultation & Financial Analysis L.L.C.. This entity is licensed by the UAE Capital Market Authority (CMA) under License No. 20200000241, and is authorised to introduce financial services and promote financial products in the UAE.
Please click the "Continue" button below to be redirected.
CONTINUEError! Please try again.

