








 Web Trader MT5








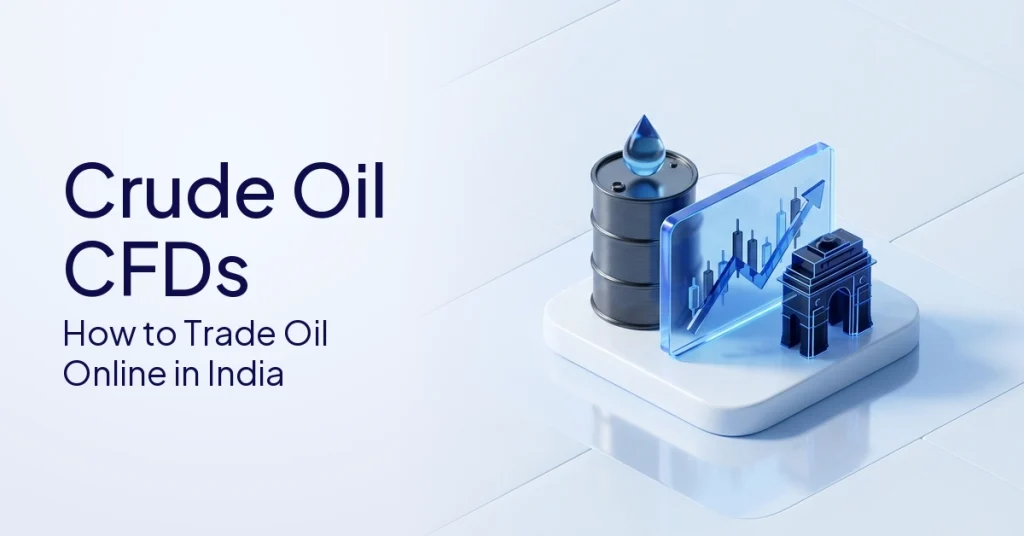
Crude oil CFDs offer traders the opportunity to speculate on global oil prices without owning physical barrels of oil or dealing with futures contracts. Have you ever wondered how retail traders take positions on global energy shifts without ever handling a barrel of oil? That’s the opportunity CFD crude oil trading offers.
Oil remains the world’s single most important commodity. CFDs (Contracts for Difference) is an agreement between you and the provider whose value tracks a benchmark oil prices. On most platforms, traders can take both long and short positions to adapt to fluctuating market conditions.
For the beginners, the two main things to grasp are the benchmarks, WTI and Brent, and what moves them, from OPEC+ policy to geopolitical shifts, are the things they must mainly grasp. This guide details the instruments, price drivers, procedures and risks. Similarly, traders can also trade gold in a similar way, through CFDs. .
Quick Answer
A crude oil CFD is a derivative contract that allows traders to speculate on the price movements of oil without having to physically purchase barrels or go into the futures market themselves. To trade oil online, a trader usually opens a supported account, finds a WTI or Brent instrument, analyzes the price chart, decides on a trade size, applies risk controls, and monitors the position until it is closed. Oil CFDs are leveraged products and carry a high risk of loss.
What Is A CFD On Crude Oil?
A CFD on crude oil is a contract to exchange the difference between the price of an oil benchmark when the contract opens and when it closes.
With this instrument, you only take a speculation on the change in price. You don’t own barrels, schedule commodity delivery or store any physical product. Your outcome is determined by the difference between the price you enter at and the price you exit at, subject to applicable costs and charges. .
What You Own
You own a contract position instead of tangible energy resources. There’s no physical delivery, shipping requirement or refinery handling at any stage.
Main Oil Benchmarks
Most online platforms provide products based on two different global benchmarks:
- WTI Crude Oil: The leading US crude benchmark.
- Brent Crude Oil: A global benchmark widely used for international energy pricing.
Long And Short Exposure
CFDs may be allowed depending on platform functionality:
- Long Position: Buying in order to potentially benefit from an increase in the underlying price.
- Short Position: Selling in order to potentially benefit from a decrease in the underlying price.
This is a mechanical feature rather than a recommendation to buy or sell.
Leverage And Margin
These instruments are generally traded on margin, which means you only need a fraction of the total trade value (margin) to open a position. Leverage increases the potential for profit and loss and is a major risk factor.
Learn what is a CFD for more on this type of trading structure.
CFD On WTI Crude Oil Vs Brent: Which Benchmark Are You Trading?
WTI and Brent are two regional oil markets that are distinct from one another in terms of price movements and supply and demand factors.
What Is WTI Crude Oil?
WTI is the U.S. crude oil benchmark. The price is strongly influenced by domestic supply, inventories at Cushing, Oklahoma, US shale production trends and domestic refinery demand.
What Is Brent Crude Oil
Brent is the world’s chief crude benchmark, setting prices worldwide. It is very sensitive to changes in global supply and demand, disruptions to shipping routes, and international geopolitical sentiment.
| Feature | WTI Crude Oil | Brent Crude Oil |
|---|---|---|
| Main Role | US crude benchmark | Global crude benchmark |
| Common Market Focus | US inventories, Cushing, US production | Global supply, geopolitics, international demand |
| Typical Trader Watchlist | EIA data, US shale, refinery demand | OPEC+, shipping flows, Middle East risk |
| Pricing Influence | More US-centric | More internationally focused |
| Platform Display | May appear as WTI, US Oil, etc. | May appear as Brent, UK Oil, etc. |
Which Should Beginners Watch?
Traders should find out the specific oil symbol that the chosen platform provides, and understand the underlying benchmark and what special forces move its price. If you want to learn more, read our full guide to WTI vs Brent crude.
Crude Oil CFD Price: What Moves Oil Prices?
Global supply, macroeconomic demand, geopolitical tension, US dollar valuation and seasonal consumption patterns drive the CFD crude oil price.
OPEC+ Production Decisions
OPEC+ production decisions influence a large part of the global supply. News of production cuts or increased output has a huge impact on market sentiment. OPEC member countries collectively hold close to 80% of the world’s proven crude oil reserves, giving the group significant long-term pricing leverage.
US Inventory Data
US Energy Information Administration (EIA) weekly inventory data show crude levels. Stock builds are indicative of weak demand or oversupply while inventory draws are indicative of a tighter market.
Geopolitical Risk
Aggressive reactions in energy markets can be influenced by international conflict, economic sanctions, threats to pipelines or instability in key producing and transit regions.
Global Demand
Consumption is a function of economic health. Data shows that oil demand is influenced by the health of global manufacturing, aviation, shipping and the growth of massive economies like China, India and the OECD.
US Dollar Strength
Oil prices are priced in U.S. dollars worldwide, so a stronger dollar means oil costs more for foreign buyers, often leading to downward pressure on prices. A weaker dollar can help support prices, but the inverse relationship is not a hard and fast rule.
Seasonal Demand
Consumption is seasonal. Petrol demand usually increases during the summer driving season, while heating oil demand tends to rise during cold winters.
Note: Market fundamentals are interconnected. Price is not driven by one thing but a constant mix of inventory data, macroeconomic demand, geopolitical stress and currency movements.
How To Trade Crude Oil Online: Step By Step
To trade oil online, you need to have a supported account, locate your benchmark of choice, examine the chart and place an order of the correct size.
Step 1: Open A Supported Trading Account
You’ll need a multi-asset or regular trading account with a provider such as STARTRADER, that provides energy instruments.
Step 2: Complete Verification
Live market access needs an identity verification. Most brokers offer demo accounts to practice with no risk.
Step 3: Fund The Account If Trading Live
You need capital to put into live environments. Positions must be supported by sufficient margin. If available margin falls below the required level, positions may be closed automatically.
Step 4: Search For WTI Oil Or Brent Oil
Locate the instrument. It might be called WTI, US Oil, Brent, UK Oil or Crude Oil, depending on the conventions of the platform.
Step 5: Open The Oil Chart
The chart gives you historical price action, and lets you choose appropriate timeframes and apply analytical tools.
Step 6: Choose Buy Or Sell
- Buy: Check this box if you expect the price to go up.
- Sell: Check this box if you expect the price to go down.
Step 7: Choose Trade Size
The size of the lot you choose to trade will determine your exposure to the market, how much margin you’ll need to hold and the monetary effect of each pip movement.
Step 8: Add Stop Loss And Take Profit If Needed
These automated risk management tools allow you to set your exit parameters and may help manage the impact of adverse price movements.
Step 9: Review The Order
Verify the symbol, trade size, margin requirements, spreads, overnight financing charges and your risk limits before you confirm.
Step 10: Monitor And Close The Position
Monitor the floating equity closely, upcoming economic news, margin levels and overall account health until the trade is closed.
Step Table
| Step | Action | Beginner Note |
|---|---|---|
| 1 | Open account | Use a supported trading setup |
| 2 | Complete verification | Usually needed for live access |
| 3 | Fund account | Only needed for live trading |
| 4 | Search WTI or Brent | Check oil or commodities section |
| 5 | Open chart | Review oil price movement |
| 6 | Choose buy or sell | Platform function, not advice |
| 7 | Choose trade size | Affects exposure and margin |
| 8 | Add SL and TP | Do not use random levels |
| 9 | Review order | Check costs, margin, and benchmark |
| 10 | Monitor position | Watch price, news, and risk |
How To Read A Crude Oil Price Chart
A crude oil chart is a visual display of the price history of a benchmark in dollars per barrel, which can help you identify trends, volatility and important market levels.
What The Chart Shows
The graph shows the price of a commodity (WTI, Brent, etc.) in US dollars per barrel over time, and how it changes.
Basics of Candlestick
- Each candle is a duration of a specific timeframe for price action.
- The body displays the open and close prices.
- The wicks show the high and low prices reached.
- Longer candles suggest high momentum and volatility.
Support And Resistance
In the past, support was a price floor where buying interest came in. Resistance is a historical ceiling where selling pressure has built up in the past.
News Timing
Sharp price moves often follow inventory reports, OPEC+ announcements, macroeconomic data and sudden geopolitical headlines.
Avoid
Don’t believe in “perfect” time frames, guaranteed technical patterns or random entry/exit points.
Key Risks Of Trading Oil CFDs
Derivatives trading exposes individuals to leverage amplification, sudden gap risk, overnight financing costs and extreme news-driven volatility.
Leverage Risk
Leverage raises exposure. Small changes in the underlying price can lead to large losses, because profits and losses are calculated on the full position value rather than the margin deposited.
Inventory Report Volatility
Market data releases can lead to sharp, immediate price repricing as the market digests new supply and demand expectations.
OPEC+ And Policy Risk
Market shocks can involve surprise policy decisions, quota changes or disputes between OPEC+ members.
Geopolitical And Weekend Gap Risk
Energy markets are sensitive to world events and prices can “gap” significantly when markets reopen after weekend conflicts or shipping disruptions.
Spread And Execution Risk
Spreads can widen dramatically on low liquidity or breaking news. In fast markets, slippage or execution delay can be a factor too.
Overnight Financing Risk
If your position is open when the daily rollover takes place, overnight financing charges may apply. These can add up and affect the cost of holding a position for longer periods.
Benchmark Risk
WTI and Brent rarely move in unison. If you don’t know what you are trading against, it is very easy to misinterpret the market data. Have a good knowledge of how leverage on oil CFDs works.
Crude Oil CFDs Vs Futures And Physical Oil
CFDs generally do not have the exchange-standardised expiries or physical delivery requirements associated with physical oil and traditional futures, providing a way to gain exposure to price movements through a trading platform.
Oil CFD vs Physical Oil
With a CFD you’re just exposed to the price through the contract. Physical oil is the real thing and needs complex storage, transport and logistics.
Oil CFD Vs Crude Oil Futures
Futures are a standardized contract traded on an exchange and have a maturity date. CFDs are platform-specific and while they usually provide more flexible sizing, they have different counterparty and financing risks.
Comparison Table
| Feature | Crude Oil CFD | Crude Oil Futures | Physical Oil |
|---|---|---|---|
| Ownership | Contract exposure only | Futures contract exposure | Physical barrels |
| Physical Delivery | No | Possible (depends on contract) | Yes |
| Contract Specs | Platform-specific | Exchange-standardised | Physical quantity/logistics |
| Leverage | Often available | Margin-based | Not typical for retail |
| Expiry | May vary by product | Has expiry | No expiry |
| Storage | No physical storage | Usually avoided by speculators | Storage required |
| Main Risk | Leverage, margin, execution, counterparty | Expiry, margin, volatility | Storage, logistics, price |
Common Mistakes Beginners Make With Oil CFDs
New traders struggle because they underestimate the harsh impact of leverage, neglect scheduled inventory data and confuse WTI with Brent.
Mistakes Checklist
- Assuming oil CFDs mean owning actual barrels of oil.
- Confusing WTI and Brent dynamics.
- Not checking which benchmark the platform is tracking.
- Ignoring the timing of scheduled US inventory reports
- Trade on OPEC+ headlines without understanding how volatile the reaction can be.
- Using leverage with no idea about the risks of margin.
- Not checking spread and overnight fees.
- Forgetting about the weekend gap risk.
- Assuming live results are assured on the basis of demo performance.
- Using random take-profit and stop-loss levels.
- Treating oil like gold or silver, without understanding the drivers of energy.
FAQs
A crude oil CFD (contract for difference) is a derivative contract that tracks the price of oil but does not give you ownership of physical oil. The result is calculated on the difference between the opening and closing prices, before spread and any financing charges. CFDs are leveraged products and can result in losses that exceed your initial investment .
Indian residents can get information on CFD products and market mechanics online. But , the availability of market access, specific product terms and regulatory availability is dependent on the provider and the individual’s circumstances.
WTI is the US benchmark for crude oil and is closely tied to supply and storage in the country. Brent is the international benchmark and reflects global supply and demand, shipping routes and geopolitical conditions more directly.
Prices are sensitive to OPEC+ production quotas, US inventories, global macroeconomic demand, geopolitical tension, refinery maintenance, seasonal consumption and the value of the US dollar.
The chart shows the past price action in dollars per barrel. It allows new traders to see the direction of the trend, its strength, the position of support and resistance levels and how the market reacts to major news. Past price action does not indicate future movement.
Conclusion
Retail traders can take positions on global energy markets through crude oil CFDs, subject to the risks associated with leverage, volatility and benchmarks. The essential point is that these instruments give price exposure without ownership.
Start by understanding the difference between WTI and Brent and the fundamental forces moving the market such as OPEC+ policies, US inventories, geopolitics and seasonal demand.
Product specifications may vary from provider to provider and leverage does increase potential losses. Traders should read the contract specifications before trading the product. There is never a guarantee in any trade and proper risk management is still key.
CFDs are complex financial instruments and carry a high risk of losing money rapidly due to leverage. You should ensure you fully understand the risks involved and carefully consider whether you can afford to take the high risk of losing your money before trading.
A crude oil CFD is an agreement between you and the provider. It gives you no ownership of, or entitlement to, physical oil, and you are exposed to the provider’s ability to meet its obligations. Margin is collateral against your position and can be lost in full. If your margin level falls below the required level, positions may be closed automatically, and automatic closure does not guarantee a particular exit level. Standard stop-loss orders are not guaranteed and may be executed at a worse level than the one selected, particularly where the price gaps. Financing charges normally apply to positions held overnight.
This content is provided for educational and informational purposes only. It does not constitute investment advice, financial guidance, or a recommendation to trade any financial instrument.
Tags


Open Live Account
 Email Address
 Phone Number
Important Notice
STARTRADER does not accept any applications from Australian residents.
To comply with regulatory requirements, clicking the button will redirect you to the STARTRADER website operated by STARTRADER PRIME GLOBAL PTY LTD (ABN 65 156 005 668), an authorized Australian Financial Services Licence holder (AFSL no. 421210) regulated by the Australian Securities and Investments Commission.
Important Notice for Residents of the United Arab Emirates
In alignment with local regulatory requirements, individuals residing in the United Arab Emirates are requested to proceed via our dedicated regional platform at startrader.ae, which is operated by STARTRADER Global Financial Consultation & Financial Analysis L.L.C.. This entity is licensed by the UAE Capital Market Authority (CMA) under License No. 20200000241, and is authorised to introduce financial services and promote financial products in the UAE.
Please click the "Continue" button below to be redirected.


